- Research
- Open access
- Published:
Emotion recognition and school violence detection from children speech
EURASIP Journal on Wireless Communications and Networking volume 2018, Article number: 235 (2018)
Abstract
School violence is a serious problem all over the world, and violence detection is significant to protect juveniles. School violence can be detected from the biological signals of victims, and emotion recognition is an important way to detect violence events. In this research, a violence simulation experiment was designed and performed for school violence detection system. Emotional voice from the experiment was extracted and analyzed. Consecutive elimination process (CEP) algorithm was proposed for emotion recognition in this paper. After parameters optimization, SVM was chosen as the classifier and the algorithm was validated by Berlin database which is an emotional speech database of adults, and the mean accuracy for seven emotions was 79.05%. The emotional speech database of children extracted in violence simulation was also classified by SVM classifier with proposed CEP algorithm, and the mean accuracy was 66.13%. The results showed that high classification performance could be achieved with the CEP algorithm. The classification result was also compared with database of adults, and the results indicated that children and adults’ voice should be treated differently in speech emotion recognition researches. The accuracy of children database is lower than adult database; the accuracy of violence detection will be improved by other signals in the system.
1 Introduction
School violence happens in school all over the world. It is recognized as one of the main reasons for dropping out of school, adolescent suicide, and even one of the causes leading to crime of youth including school shooting. Violence events in school can be stopped by classmates, teachers, or parents, but many of them do not know their friends, pupils, or children are victim of school violence events [1, 2].
Some violence detection system is designed to help the bullied children. The ICE Blackbox is a personal security app. When a violence event occurs, the user is able to press a button to activate the ICE Blackbox. Then, the system will record the audio, video, and GPS location and send the information to the ICE Blackbox secure servers. In the app Tip Off, school violence as well as crimes can be reported to the server by text. So far, this kind of apps all requires manual activation, but most of the time, it is difficult for bullied children to active the app manually in real violence situation. So it is urgent to develop a system that is able to detect the status of children and send information and alarm automatically when violence happens [3, 4].
Physical and psychological traumas are the two main injuries caused by school violence. By using sensors and pattern recognition technology, the status of human body and emotion can be detected. This technique has proved very useful for identifying violence because the changes of human body and emotion can be detected during violence events. Physical movement changing such as being hit, being pushed, and falling down which occur frequently when being bullied can be detected by accelerometer and gyroscope. Some negative emotions, such as anger, fear, anxiety, and sadness, can be detected from voice signal, ECG signal, and so on. Violence events can be detected, and also, the accuracy will be improved by combining emotion and physical changing detection [5, 6]. The goal of our research is to design a violence detection system using these signals which can detect violence events and notify the responsible person automatically to stop the violence events.
This paper focuses on emotion recognition of voice signal in the violence detection system. In Section 2, emotions in violence events are analyzed. In Section 3, a kind of speech emotion recognition algorithm with consequential eliminating process (CEP) is presented. Then, parameters of support vector machine (SVM) are optimized, and Berlin voice database is used to test and verify the algorithm. In Section 4, a school violence simulation experiment performed in an elementary school is described, from which voice signals database are extracted. The database extracted from the experiment is processed by CEP algorithm, and the calculation result is presented and analyzed.
2 Emotions in violence events
What kind of emotions pupils have during the violence events is an important issue for emotion detection research. A research focused on emotional reaction of school violence victims has carried on 6282 Maltese schoolchildren between 9 and 14 years of age. The results showed that most pupil victims felt angry, vengeful, helpless, and self-pity, and about 24% of the victims felt indifferent [7, 8]. Another research presented a survey on violence victims in three countries (England, Italy, and Spain) revealed that the victims are angry (42.7%), upset (34.8%), stressed (22.4%), worried (24.3%), afraid (18.1%), alone (14.3%), defenseless (14.3%), and depressed (18.9%) [9]. Both the researches showed that the victims have negative emotions during the violence events.
Generally, the term emotion describes the subjective feelings in short periods of time which are related to events, persons, or objects [10, 11]. Since the emotional state of human is a highly subjective experience, it is hard to find objective and universal definitions. This is the reason there are different approaches to model emotions in the psychological literature. One approach is the definition of discrete emotion classes, the so-called basic emotions. Ekman defined seven emotions which humans are very familiar with: happiness, sadness, anger, anxiety, boredom, disgust, and neutral [12]. These seven emotions are considered as the basic emotions, and more emotions can be defined by mixtures of the basic emotions [13]. According to this theory, the emotions, which the school violence victims have in above two researches, can also be defined by mixtures of the basic emotions. Analyzing these emotions generated by school violence victims, the negative emotions consist of three basic emotions: anger, sadness, and fear. So the detection of these three basic emotions may indicate that violence events happened. Combined with movement and other bio-signal detection, the accuracy of violence detection might be improved.
3 Methods
3.1 Classification algorithm with consecutive elimination process
In pattern recognition researches, feature is the most important parameter to distinguish one kind of speech from another. Since many features can be extracted from voice signals, it is critical that right features are selected to classify different labels. Feature selection is often used to choose the best feature set to classify the labels. It appears that when classifying more labels, it is challenging to get higher accuracy. The reason is that in emotion recognition, different emotion is sensitive to different features. When a useless feature is added to a good set of features, the performance of the classifier will decrease. It was found that feature selection gives the highest accuracy when the number of labels is two. So when emotional speeches are classified, it is better to make the classifier always working between two labels. In this paper, consecutive elimination process (CEP) is proposed to classify the emotional speech. It makes classifiers working between two labels, and the best feature set is chosen for each classifier in order to get the highest accuracy.
Before the CEP, feature selection work is done between each two labels within the database. The best feature set and the classify accuracy of each two labels can be get through this procedure. A table with labels, selected feature sets, and classifier accuracy of each two labels which is called LFA table is created.
Figure 1a shows an example of this process. Suppose the database has n classes of objects and the labels are marked as 1, 2, 3, …, n. For this n-label database, n (n − 1)/2 times of feature selection is done between each two labels. The LFA table contains the results of each feature selection procedure. The first column of the LFA table records the number of labels such as (1, 2), (1, 3), (1, 4), …, (n − 1, n). The following columns are the corresponding classifier (C1, C2, C3,…, Ck), the selected feature set (Fset1, Fset2, Fset3, …, Fsetn), and the classify accuracy (A1, A2, A3, …, Ak) in which k = n(n − 1)/2. With this LFA table, k kinds of classifiers can be set up with corresponding feature set to classify any two labels in the database.

Example of consequential eliminating process in LFA table. Figure 1 shows a process of CEP algorithm. Suppose Ai is the maximum accuracy value in a. For the first layer, the classifier Ci with the maximum accuracy is chosen. The testing sample is then classified by classifier Ci with feature set Fseti between label 2 and label n. Suppose the result of the first layer is n. It is believed that the testing sample does not belong to label 2. Then, lines with label 2 are eliminated from the original LFA table as shown in b. For the second layer, the above processes are repeated again with the new LFA table shown in c and another label is eliminated from the new LFA table. The rest may be deduced by analogy. After n − 2 layers of classification, there will be only one line left in the LFA table. This last classifier gives the final predicted label of the testing sample
The CEP begins when a testing sample is ready to be classified. This process divides the classification procedure into several layers. In each layer, one possibility of predicted label is excluded until the final predicted label is calculated out. And for each layer, the classifier with the highest accuracy in LFA table is chosen.
Take Fig. 1 as an example. Suppose Ai is the maximum accuracy value in Fig. 1a. For the first layer, the classifier Ci with the maximum accuracy is chosen. The testing sample is then classified by classifier Ci with feature set Fseti between label 2 and label n. Suppose the result of the first layer is label n. Since there are n labels in the database and only two labels are used in the first layer classifier, the result label n does not mean that the final predicted result of the testing sample is label n. While it is believed that the testing sample does not belong to label 2 because label 2 is excluded during the first layer classifier, then lines with label 2 are eliminated from the original LFA table as shown in Fig. 1b. For the second layer, the above processes are repeated again with the new LFA table shown in Fig. 1c and another label is eliminated from the new LFA table. The rest may be deduced by analogy. After n − 2 layers of classification, there will be only one line left in the LFA table. This last classifier gives the final predicted label of the testing sample.
In the CEP, a high classify accuracy is guaranteed because the classifier with the highest accuracy is chosen in each layer.
3.2 SVM and parameters optimization
SVM is a classifier widely used in classification of two classes. Theoretically, SVM is divided by hyperplane and hyperplane is the decision boundary between two classes [14]. Figure 2 is an example of two classes classification, and the hyperplane is a line in two-dimensional space (green circle and red X are different classes of data).

The principle of SVM hyperplane in two-dimensional space. The green circle and red X stand for two kinds of data. A line separates two kinds of data in the space which is the hyperplane in the space
If there are many hyperplanes that can divide the data as shown in Fig. 3, a best one should be chosen. It is considered that the distance between hyperplane and the data nearest to the hyperplane should be as far as possible, because the data is further from the boundary and the probability of error is smaller.

Shows the principle of best hyperplanes selection. In two-dimensional space, the training data (green circle and red X) can be separated by many hyperplanes, so selection is an important process for the classifier. That is the principle of parameters optimization of SVM
So optimizing SVM is to choose the best hyperplane. Optimization strategy is to make the distance between the hyperplane and the nearest data farther. Therefore, SVM is called “the large margin classifier.” The question can be described by the following mathematical formulas.
‖ω‖is the bound norm of ω. γi is the distance between nearest data and the hyperplane, and it is usually supposed that γi = 1 to simplify the calculation.
In machine learning, convex optimization method is often used to solve optimization question. Therefore, the mathematical formulas can be transformed from \( \max \frac{1}{\left\Vert \omega \right\Vert } \) to
Lagrange duality is efficient to solve the problem, because it is easy to solve and bring in kernel function to solve nonlinear problems. Lagrange function is established as below.
Derivation of the function presents,
Sequential minimal optimization is used to calculate b and α. Through the above method, strict equation of hyperplane is got, which allows little error. Soft margin allows some errors in the classification, and the error is controlled not to be large; therefore, a penalty coefficient is added. The optimized model changes.
C is a penalty coefficient of the soft margin. The optimizing method which is the same as the model does not have a soft margin.
The core of SVM is the kernel functions. Kernel function converts computation from high-dimensional space to low-dimensional space, that means it can map after calculating. This helps us to reduce a large amount of calculation and save calculating time. Parameter g is in the kernel function and should be optimized for better performance.
Parameters optimization is an important process. Parameters of SVM affect the accuracy of the classification results. The classification algorithm proposed in part 3 uses SVM classifier between each two labels, and parameters optimization is needed for every classifier, so n (n − 1)/2 sets of parameters should be optimized if there are n labels in the database.
K-fold cross-validation is used in the parameters optimization process. Firstly, the database is divided into two parts: 33% of which is used for testing data and 67% of which is used for training data, and secondly, the training data is divided into two parts: 25% of which is used for training SVM and 75% of which is used for validation of parameters optimization, as shown in Fig. 4. For cross-validation divides the database randomly, parameters optimization works four times and makes sure the whole training data can be used as validation. The mean accuracy is used to determine the optimized parameters. After parameters optimization, the testing data is used to compare the accuracy between default parameters and optimized parameters. This will increase the adaptation of the classifier, and the result is more convictive because the testing data is not used during the parameters optimization process at all.
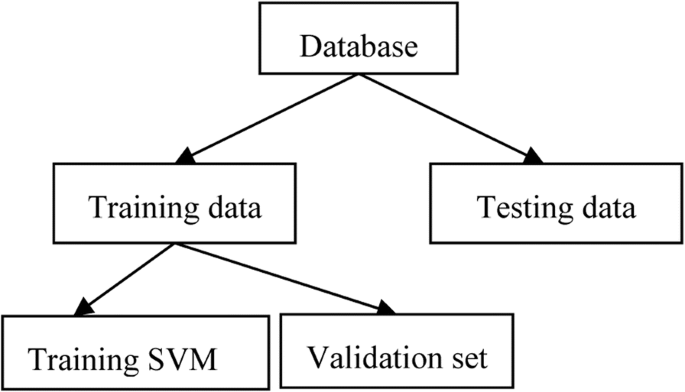
Shows the data validation process. The database is divided into two parts. Firstly, 33% of which is used for testing data and 67% of which is used for training data. Secondly, the training data is divided into two parts, 25% of which is used for training SVM and 75% of which is used for validation of parameters optimization
For SVM, classifier parameters c and g are needed to be optimized. The range of c is from 0.1 to 10 with step length of 0.1, and the range of g is from 0.01 to 1 with step length of 0.01 parameters optimization.
In order to verify the algorithm, the Berlin database with emotional speech, which is very popular in emotion recognition research, is analyzed by this algorithm. Berlin database contains 535 sentences spoken by 10 actors in happy, angry, fearful, sad, bored, disgusted, and neutral version. These seven emotions are marked from 1 to 7 as seven labels shown in Table 1. In the following content, labels 1 to 7 are used instead of the seven emotions. The analyzing results of Berlin database can be easily compared with other research. If the accuracy of the algorithm proposed above is good, the algorithm is effective in emotion recognition and can be used to analyze the data in violence simulation.
Berlin database is used to optimize the parameters. There are seven emotions in the database, so 21 sets of parameters should be optimized. The optimized parameters are shown in Table 2. For different labels, the optimized parameters are different and the classification accuracy increases after parameters optimization.
3.3 Algorithm verification by Berlin database
3.3.1 Feature extraction
The first step to deal with the database is feature extraction. The emotional speech is usually divided into frames by Hamming window, and original features are extracted from the emotional speech by frames. In this research, the following original features are used which are shown in Table 3, and they are marked as f1 to f16 in the following content.
The software “Opensmile” is used to extract the features from speeches in the Berlin database. There are 384 features as statistical functional is applied to low-level descriptor contours. The contour is smoothed after extracting the original value by frame. The smoothing method “sma” indicates that they were smoothed by a moving average filter with window length 3. And the smoothing method “de” indicates that the current feature is a first-order delta coefficient (differential) of the smoothed low-level descriptor. Then, the statistical function is applied to the contour, and 12 statistical functions which are marked as S1 to S12 are presented in Table 4.
Figure 5 shows the detailed feature process procedures. The original feature contours (f1–f16) are first smoothed by two methods separately, and then 12 statistic functions are applied to the smoothed contours. Figure 5 also shows the numbering scheme for the 384 features. Final features got from f1–f16 with statistic functions S1–S12 and smoothing method “sma” are numbered as F1–F192. And final features got from smoothing method “de” are numbered as F193–F384. With this numbering scheme, the source of the final feature can be found out easily and it is convenient to use the numbered features in the following work.
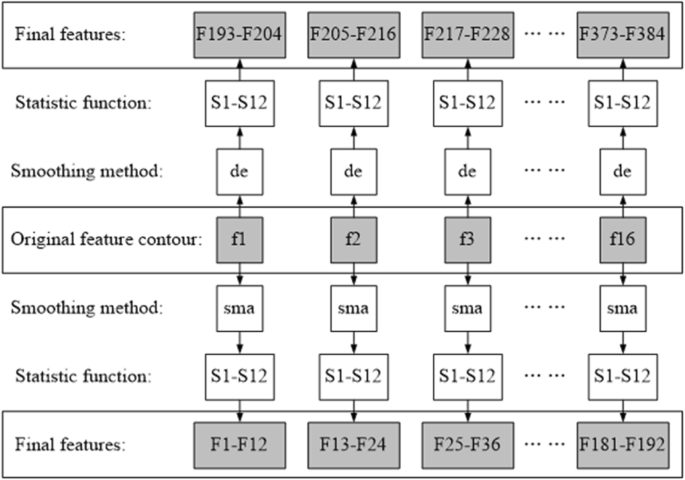
Shows the detailed feature process procedures. The original feature contours (f1–f16) are first smoothed by two methods separately and then 12 statistic functions are applied to the smoothed contours. Figure 5 also shows the numbering scheme for the 384 features
3.3.2 Features selection
Feature selection is an important step before a classifier is set up. With the proper feature set, the accuracy of the classifier would be higher. And even with different training and testing samples in the same database, the result of feature selection process for the same classifier would be different.
Sequential forward-floating search method is used between each two labels in the Berlin database. Since with different samples the feature selection result would be different, the feature selection process was run 100 times for each two labels. The set with the maximum number of repetitions in the 100 results was chosen as the final selected feature set for the corresponding two labels. As SVM classifier would be used in the CEP procedure, the feature selection process also used SVM to generate the discriminant function.
Table 5 is the LFA table got from the Berlin database using the above feature selection method. The second column is the final features number, which can be found above in Fig. 5.
3.3.3 Calculation results
The Berlin database is classified with CEP procedure using LFA table in Table 5. There are two sets of labels with the maximum accuracy of “100%” in the LFA table, and the first layer of classifier is chosen randomly from them. Fourfold cross-validation is used to divide the database into training data and testing data, and SVM classifier with optimized parameters is used. The classify process is run 25 times to reduce contingency because the fourfold cross-validation divides the database randomly.
The results show that with the CEP procedure, the highest accuracy is 82.24%, the lowest accuracy is 76.44%, the mean accuracy is 79.05%, and the standard deviation is 0.0147. The confusion matrixes of the best result are shown in Table 6 in detail.
Berlin database is often used in verification and comparison of algorithm for speech emotion recognition. The results with CEP procedure show a high classify accuracy, which indicates that CEP procedure works well for speech emotion recognition. So this method can be used to analyze the emotional speech extracted from the violence simulation experiment in the following work.
4 Experiments
4.1 Violence simulation experiments
A violence simulation was conducted to collect signals for this study at Normaalikoulu Elementary School in Oulu, Finland. The experiments were designed by some psychologists in University of Oulu in Finland. The second- and sixth-grade pupils of Normaalikoulu Elementary School in the city of Oulu, Finland, joined the experiments, and they were arranged in three-pupil small groups in the classroom. The pupils take turns to play as bullies and victims. The drama series were used to create school violence activities which are used to simulate the real school violence. Of course, the experiments are allowed by the pupils’ parents, and the detailed experiment plan was discussed and permitted by the Ethics Committee of University of Oulu, so that the experiment will not affect the pupils anyway. The whole experiments are divided into five parts as follow.
The first task of every group was to simulate verbal violence (being called names or insulted) to one member of the group in the restricted area 3 × 3 m. The group was not allowed to step out of the area; otherwise, the trial was stopped and started again. Each member of the group was simulated bullied in random order by the other two members of the group, and physical contact was forbidden.
The second task is freedom physical violence game. One pupil played the role of the victim and was asked to try his/her best to stay in the 3 × 3 m2. Two pupils played the role of bullies and tried to push the victim out of the area. When the victim was pushed out, the game stopped. The members played the role of victim in turn.
The third task is emotional speech. All the pupils were taught and led to speak some sentences in five different basic emotions. Non-emotional sentences such as “There is a green carpet on the floor.” are chosen in this part. The five basic emotions were happiness, sadness, fear, anger, and neutral.
The fourth task is special activities and movements simulation. Some special activities happened during violence events were simulated, such as being pushed from various direction, being stumbled down, being knocked with shoulder, and being shaken by holding the shoulders. These activities were carried out under protection of soft mattresses. And also, some common movements, such as walking, running, jumping, and playing normal games, are carried out control.
The last part is relaxation. All the pupils lay down on the mattresses and close their eyes. One psychology teacher told a relaxing story with light music. The purpose of this section was to make both children’s physical and mental state restored to normal.
Data was collected from pupils using different procedures including pre- and post-interviews and video analysis. The activities of the groups were video recorded by MORE recording system (Multimodal Recording System) for the later analysis [15]. The emotional speeches in task three are also recorded by MORE recording system. The heart rate variability (HRV) was measured using beat-to-beat RR-intervals with Zephyr heart rate monitoring system (Zephyr Co.). The HRV recordings were synchronized with MORE recording system. The postures, breathing rates, body temperatures, saliva samples, and speech signals were also collected. In addition, acceleration sensors were used to measure participants’ physical movements during the tasks, and with the aid of the developed algorithms, the violence events were automatically collected from the raw data for further analysis. Open-ended interview questions were used in pre- and post-interviews to define the mood and emotions of the participants.
The emotional speeches recorded in task three were extracted and analyzed in this paper. It was believed that during verbal and physical violence simulation in tasks 1 and 2, negative emotions would be generated. The following emotional speech task would record part of the real negative emotion generated during violence simulation so that analyzing the emotional speeches in task 3 was approximately equal to analyzing the voice signals during violence situation.
4.2 Children database
The emotional speeches of children are extracted from the emotional speech task of the violence simulation experiments. Children are led to act a violence simulation event designed by psychologists. It is believed that negative emotions will generate during this simulation, which is proved by the feeling meter test of the children before and after the violence simulation. The emotional speech task is performed just after the simulation so part of the negative emotions will be kept during the emotional speech task.
In the emotional speech task, totally, 12 children are asked to speak three sentences in five emotions: happiness, sadness, fear, anger, and neutral. Three girls and three boys of the children are from grade 2, and another three girls and three boys are from grade 6. The three sentences are in Finnish that are shown in Table 7, because the experiment is performed in Finland. The children are asked to speak each sentence in each emotion for two or three times. After getting rid of the voice in poor quality, there are 382 clips of speech in five emotions.
4.3 Classification of emotional speech extracted from violence experiment
The CEP procedure of classification is used to the database extracted from the violence experiment. The “Opensmile” is also used for feature extraction, and 384 features are extracted for each speech clip. These 384 features are the same as that in Section 5 and numbered also in the same way. Table 8 is the LFA table of the violence simulation database after feature selection processes.
Four cross-validations and SVM classifier are used for the classification, and each procedure is run for 25 times. The results show that the highest accuracy is 60.63%, the lowest accuracy is 53.68%, and the mean accuracy is 66.13%. The standard deviation is 0.0236. The confusion matrixes of the best result are shown in Table 9 in detail.
5 Results and discussion
Comparing the results from Berlin and violence simulation databases, it can be seen that the mean accuracy of the Berlin database is about 12% higher than the accuracy of violence simulation database from children and the range of the accuracy difference between max and min of violence simulation database is bigger than that of the Berlin database. The reason is that some children were always in a happy and excited state during the experiment, and they cannot control the voice as well as the adult actors in the Berlin database. In some speech in sad emotion, light laughing can be heard in the violence simulation database. That is the limitation of the violence simulation database.
From the LFA table, it is presented that the selected feature sets for the same two labels are totally different between adults and children. It indicates that children’s voice is different from adults, so the classification of adults and children’s speech should be treated differently in research of emotion recognition.
Also seen from the LFA table, for Berlin database, the two labels with the lowest classification accuracy are labels 1 and 2. It means that for adults, the emotions which are the most difficult to separate is happiness and anger. While for children’s speech in violence simulation database, the labels most difficult to separate is sadness and fear (lowest accuracy in LFA table). This is another proof of the difference between voices of children and adults, and it also shows the significance of classifying the children’s speech individually. Fortunately, sadness and fear are all emotions generated in violence events and the influence to violence detection system is not serious.
So far, the accuracy of reorganizing emotion from voice of children is not as high as adults, but this result is helpful for the violence events detection system. Combined with other signal such as ECG, movement, temperature, and breathing, the system may give good performance to detect school violence events and help to protect children in our future work.
6 Conclusion
In order to develop a school violence detection system, a school violence simulation experiment is proposed and the experiment is performed in Normaalikoulu Elementary School in Oulu, Finland. The emotional speech extracted from the experiment is analyzed in this paper.
A CEP procedure is proposed in this paper for the emotion recognition. Both Berlin and violence experiment databases are analyzed with the procedure using SVM classifier, and the mean accuracy for the two databases is 79.05% and 66.13%. It shows that the CEP procedure got a high accuracy for speech emotion recognition. Comparing Berlin and violence experiment databases’ result, the properly selected features and the difficulties of emotional speech recognition are different between adults and children. It indicates that children’s voice is different from adults, so the classification of adults and children’s speech should be treated differently in research of emotion recognition.
Though the accuracy of emotion recognition with CEP procedure for children database is not as high as that of adults’ database, the proposed experiment and CEP procedure will contribute to the multi-signal system for violence events detection.
Abbreviations
- CEP:
-
Consecutive elimination process
- ECG:
-
Electrocardiogram
- GPS:
-
Global Positioning System
- HRV:
-
Heart rate variability
- LFA:
-
Label feature accuracy
- SVM:
-
Support vector machine
References
D. Olweus, School bullying: development and some important challenges. Annu. Rev. Clin. Psychol. 9, 751–780 (2013). https://doi.org/10.1146/annurev-clinpsy-050212-185516
E. Menesini, C. Salmivalli, Bullying in schools: the state of knowledge and effective interventions. Psychol. Health Med. 22, 240–253 (2017). https://doi.org/10.1080/13548506.2017.1279740
J. Wang, R.J. Iannotti, T.R. Nansel, School bullying among adolescents in the United States: physical, verbal, relational, and cyber. J. Adolesc. Health 45(4), 368–375 (2009). https://doi.org/10.1016/j.jadohealth.2009.03.021
T. Vaillancourt, R. Faris, F. Mishna, Cyberbullying in children and youth: implications for health and clinical practice. Can. J. Psychiatry 62(6), 368–373 (2017). https://doi.org/10.1177/0706743716684791
A. Foteini, H. Dimitris, K. Anderson Adam, ECG pattern analysis for emotion detection. IEEE Trans. Affect. Comput. 3(1), 102–115 (2012). https://doi.org/10.1109/T-AFFC.2011.28
L. Ye, H. Ferdinando, T. Seppanen, An Instance-Based Physical Violence Detection Algorithm for School Bullying Prevention (11th IEEE International Wireless Communications and Mobile Computing Conference, Dubrovnik, 2015), pp. 24–25
M.G. Borg, The extent and nature of bullying among primary and secondary schoolchildren. Educ. Res. 41(2), 137–153 (1999). https://doi.org/10.1080/0013188990410202
L.R. Barhight, J.A. Hubbard, C.T. Hyde, Children’s physiological and emotional reactions to witnessing bullying predict bystander intervention. Child Dev. 84(1), 375–380 (2013). https://doi.org/10.1111/j.1467-8624.2012.01839.x
M. Giménez Gualdo Ana, C. Hunter Simon, D. Kevin, The emotional impact of cyberbullying: differences in perceptions and experiences as a function of role. Comput. Educ. 82, 228–235 (2015). https://doi.org/10.1016/j.compedu.2014.11.013
M.A. Quiros-Ramirez, T. Onisawa, Considering cross-cultural context in the automatic recognition of emotions. Int. J. Mach. Learn. Cybern. 6(1), 119–127 (2015). https://doi.org/10.1007/s13042-013-0192-2
M. Waseem, M. Ryan, C.B. Foster, Assessment and management of bullied children in the emergency department. Pediatr. Emerg. Care 29(3), 389–398 (2013). https://doi.org/10.1097/PEC.0b013e31828575d7
H. Saarimaki, A. Gotsopoulos, I.P. Jaaskelainen, Discrete neural signatures of basic emotions. Cereb. Cortex 26(6), 2563–2573 (2016). https://doi.org/10.1093/cercor/bhv086
H. Schlosberg, Three dimensions of emotion. Psychol. Rev. 61(2), 81–88 (1954). https://doi.org/10.1037/h0054570
X.D. Wu, V. Kumar, J.R. Quinlan, Top 10 algorithms in data mining. Knowl. Inf. Syst. 14(1), 1–37 (2008). https://doi.org/10.1007/s10115-007-0114-2
A. Keskinarkaus, S. Huttunen, A. Siipo, MORE - a multimodal observation and analysis system for social interaction research. Multimed. Tools Appl. 75(1), 6321–6345 (2016). https://doi.org/10.1007/s11042-015-2574-9
Acknowledgements
The authors acknowledge the Natural Science Foundation of Heilongjiang Province of China (Grant No. F201315) and Harbin Research Fund for Technological Innovation (No.2013RFQXJ104) and Scientific research project of Heilongjiang provincial department of education (No. 12541144).
Funding
The research presented in this paper was supported by the Heilongjiang Provincial Science and Technology Department of China, Heilongjiang Provincial Education Department of China, and Harbin Municipal Science and Technology Bureau of China.
Availability of data and materials
The data and materials in this paper are all true and available.
Author information
Authors and Affiliations
Contributions
TH is the main writer of this paper. He proposed the main idea of the algorithm for emotion recognition, joined the whole experiment, and calculated the results. JZ optimized the parameters of SVM. ZZ processed the children’s voice and founded the database. ZZ, HF, and GS all joined the experiment and helped extracted the data. EA and TS designed the experiment and helped finish the experiment. XY helped to improve the algorithm and the manuscript. SY wrote the code of classifier. All authors read and approved the final manuscript.
Corresponding author
Ethics declarations
Ethics approval and consent to participate
Not applicable.
Consent for publication
Not applicable.
Competing interests
The authors declare that they have no competing interests.
Publisher’s Note
Springer Nature remains neutral with regard to jurisdictional claims in published maps and institutional affiliations.
Rights and permissions
Open Access This article is distributed under the terms of the Creative Commons Attribution 4.0 International License (http://creativecommons.org/licenses/by/4.0/), which permits unrestricted use, distribution, and reproduction in any medium, provided you give appropriate credit to the original author(s) and the source, provide a link to the Creative Commons license, and indicate if changes were made.
About this article

Cite this article
Han, T., Zhang, J., Zhang, Z. et al. Emotion recognition and school violence detection from children speech. J Wireless Com Network 2018, 235 (2018). https://doi.org/10.1186/s13638-018-1253-8
Received:
Accepted:
Published:
DOI: https://doi.org/10.1186/s13638-018-1253-8