- Research Article
- Open access
- Published:
Spectrum Sensing for Cognitive Radios with Transmission Statistics: Considering Linear Frequency Sweeping
EURASIP Journal on Wireless Communications and Networking volume 2010, Article number: 123674 (2010)
Abstract
The spectrum sensing performance of Cognitive Radios (CRs) considering noisy signal measurements and the time domain transmission statistics of the Primary User (PU) is considered in this paper. When the spectrum is linearly swept in the frequency domain continuously to detect the presence of the PU the time-domain statistics of the PU plays an important role in the detection performance. This is true especially when the PU's bandwidth is much smaller than the CR's scanning frequency range. We model the transmission statistics that is the temporal characteristics of the PU as a Poisson arrival process with a random occupancy time. The spectrum sensing performance at the CR node is then theoretically analyzed based on noisy envelope detection together with the time domain spectral occupancy statistics. The miss detection and false alarm probabilities are derived from the considered spectral occupancy model and the noise model, and we present simulation results to verify our theoretical analysis. We also study the minimum required sensing time for the wideband CR to reliably detect the narrowband PU with a given confidence level considering its temporal characteristics.
1. Introduction
The Cognitive Radio (CR) concept is being under deep consideration to opportunistically utilize the electromagnetic spectrum for efficient radio transmission [1–4]. The CR basically acts as a secondary user of the spectrum allowing the incumbent (primary) users of the spectrum to have higher priority for spectrum utilization.The notion of efficient spectrum utilization has also attracted the radio spectrum regulatory bodies around the world [5, 6] to further investigate the technology. The secondary users therefore need to learn the environment in the presence of any primary users (PUs) and keep track of them to ensure that it does not interfere with the PU.Learning the environment and performing radio scene analysis (RSA) becomes a challenging and an essential task for the CR to successfully perform secondary communication with reduced interference to the PU. Reliably performing the RSA is quite important in order to avoid interfering with the PU's communications and also to satisfy the regulatory requirements. To perform such an RSA, the CR nodes need to sense the spectrum continuously in the time, frequency, and spatial domains. Spectrum sensing therefore, amongst many, is one of the key functionalities of a CR in order to perform (RSA) of the communication environment.
1.1. Problem Statement
In the recent years, Ultra Wideband (UWB) technology has emerged as one of the key candidates for CR based secondary user communications [7, 8]. When UWB technology is used as CRs for secondary communications, it is required to scan the entire spectrum from  GHz–
GHz– GHz (in many cases a significant portion of it) to detect the presence of any PUs in the network. In such situations, scanning a wide range of frequencies (
 GHz) can be a time consuming process and hence a narrow band PU, which has a bandwidth much smaller than the UWB node, can be gone undetected when the UWB-CR node is scanning a large portion of the spectrum. It is obvious to state that such miss detection depends on the PU's transmission statistics, or in other words the Spectral occupancy Statistics (SoS) as well as the spectrum sniffing hardware unit of the UWB-CR node and the corresponding time required to sense the spectrum. Such a problem is considered to be a crucial one to be solved by many researchers and engineers working in this filed, such as in the European Union funded 20 M-Euros project on EUWB [8]. The problem defined here is not specific to UWB based CR systems only, but in general it applies to any CR systems with a bandwidth much larger than the bandwidth of the potential victim services (i.e., the PUs) in the network.
1.2. Literature Review
Spectrum sensing techniques have been heavily discussed and treated in the literature and one could refer to [3, 4, 9–28] for further reading. The performance of different spectrum sensing techniques are measured in terms of the probability of false alarm and the probability of miss detection for noisy sensing. In our work however, in addition to noisy sensing, we also include the SoS (i.e., the temporal characteristics) of the PU and analyze the detection performance of the CR nodes for wideband sensing. In order to perform theoretical analysis some mathematical models should be followed for the temporal characteristics of the PU. The Poisson model for the arrival process is the most common model used in the research literature for theoretical derivations and performance analysis [29–40], and also recommended in the International Telecommunication Union's (ITU) handbook on Teletraffic Engineering [32]. Moreover, Poisson models are also verified for several cases [34–40], especially for the Internet traffic when the load is higher [34]. Therefore, we adopt such a model in our work. It should be noted that there also exist empirical models for various traffic sources [29, 30, 30, 31, 31–44] and for various radio access technologies mostly derived from the Poisson arrival process.
Furthermore, the authors in [21] have used the Poisson traffic model to design an admission controller for the CR node to improve the Quality of Service (QoS) for secondary transmissions. In [22], for Poisson based PU traffic, the authors have studied by means of simulations the trade-off between sensing time and the achievable throughput by considering the probability of collision. The Poisson traffic model is also used in [23, 24] to derive a-priori probability based detection schemes for spectrum sensing and have presented some numerical results on the improvement over the traditional energy-based detection [45] and the classical Maximum Likelihood- (ML-) based detection techniques [46], respectively. A channel selection scheme for CR nodes for a multichannel multiuser environment is also proposed-based on Poisson traffic model in [25], and recently in [26, 27] we have studied the performance of shared spectrums sensing for UWB-based CR assuming the Poisson model for the PU. Furthermore, moving away from the Poisson based theoretical model, the authors in [47] have analyzed the performances of dynamic spectrum access techniques based on experimentally measured spectrum occupancy statistics.
1.3. Contribution
In this paper, we study the performance of detecting the PU based on its time domain SoS, by classifying them as light, average or heavy users of the spectrum, together with noisy sensing at the CR nodes. We mainly consider the case where the PU bandwidth is much smaller than the CR's spectrum scanning frequency range. Though the references in [22–26] have considered the Poisson model for the PU channel SoS they have presented mainly some simulation results to analyze the performances of the the CR node for spectrum sensing and channel occupancy efficiency. In our work presented here, we perform some detailed theoretical analysis of the performance of PU detection, based on an envelope-based energy detector, by initially considering the transmission statistics only case and then together with the sensing noise. The theoretical anaylses are also verified by simulations. We also study the minimum required sensing time for the CR node to reliably detect the narrow band PU given its temporal characteristics.
1.4. Paper Organization
The rest of the paper is organized as follows. In Section 2, we provide the model for the CR network, and in Section 3, we derive the Poisson arrival model for the PU's transmission statistics from the fundamentals. In Section 4, we provide the signal envelope based spectrum sensing technique followed by some theoretical analysis on the detection performances for the noiseless case with a constant channel occupancy (hold) time in Section 5. In Section 6, we present a PU detection risk analysis based on the transmission statistics (Poisson process) of the PU. In Section 7, we present the detection performance considering noise, and in Section 8, we extend the analysis for a random channel occupancy (hold) time. In Section 9, we present the sensing time requirements for the CR based on the SoS of the PU, and finally we make some concluding remarks in Section 10.
2. Cognitive Radio-System Model
The CR network model is presented in this section. We define the following parameters for the wideband sensing CR nodes and the PU in the network. For the PU, we define  as its transmission bandwidth,
  as the time duration between transmissions (spectrum idle time) that is calculated from the end to the beginning of two successive transmissions, and
  as the PU's transmission duration (spectrum hold/busy time) per transmission. For the CR node, we define
  as the total observation bandwidth to sweep, and
  as the total time to linearly sweep the observation bandwidth
  . Linear sweeping is defined by having some constant rate for sweeping the frequency, or in other words the time to sweep a range of frequencies is proportional to the same range of frequencies. Figure 1 depicts the above parameters and also shows the frequency-time observation plot which explains the spectrum scanning process of the wideband sensing CR node. As depicted in the figure, the cognitive radio scans the entire spectrum linearly at a rate of
  . Using such a linear frequency sweeping process, given that the PU is transmitting, the CR node can only detect the PU during its m th scan within the time slot (only) from
  and
and  , where
  is an arbitrary real constant,
  and
and  are the edge frequencies of the transmission bandwidth of the PU with
  , and
, and  . Below, we summarize the abovementioned parameters:
-
(i)
 —PU transmission bandwidth,
 -
(ii)
 —time duration between successive transmissions, and the time duration of transmission of the PU, respectively,
 -
(iii)
 —edge frequencies of the PU transmission bandwidth (
 ),
), -
(iv)
 —total bandwidth to be scanned by the CR node,
 -
(v)
 —average time to scan the frequency band
  by the CR node,
 -
(vi)
 —start and end times of scanning the PU bandwidth by the CR node, as shown in Figure 1, during the m th iteration.
 —PU transmission bandwidth,
 —time duration between successive transmissions, and the time duration of transmission of the PU, respectively,
 —edge frequencies of the PU transmission bandwidth (
 ),
), —total bandwidth to be scanned by the CR node,
 —average time to scan the frequency band
  by the CR node,
 —start and end times of scanning the PU bandwidth by the CR node, as shown in Figure
Linear ultra wideband spectrum scanning process for detecting a narrow band primary user: The frequency versus time plot.
The presence of a PU in the network is defined by the hypotheses  and
and  , as described in (1). Given that the PU is detected during the m th scan, the CR decides upon
  for the entire period of the scan before reinitializing it back to
  for the successive scan (i.e.,
  th scan). The hypothetical decision
  made by the CR node at the end of every scan for the particular PU within the frequency band of
  and
and  in the absence of noise can be mathematically defined as follows:

A more generic detection model considering the PU SoS together with the sensing noise at the CR node is provided in Section 4. The PU's transmission is modeled as a Poisson arrival process. Therefore,  follows an exponential distribution [30] with a mean time between transmission given by
  . We validate the Poisson arrival model for the CR network that we consider here by referring back to Section 1: Literature Review. In other words, the CR network model considered here has a PU delivering Poissonian traffic to the network within its frequency band. Initially, we treat the transmission duration (hold time)
  of the PU as a constant to simplify the analysis and then in Section 8 we extend the analysis to a random transmission duration
  by modeling it as a random process.
Furthermore, based on the values of  and
and  we can characterize the spectral occupancy levels of a PUs as light, average, or heavy users. Figure 2 depicts the spectral occupancy levels of a PU based on their traffic characteristics. In the figure, we further see that the pairs
  and
and  separate the occupancy level regions of the PUs as light, average, or heavy. Corresponding to the occupancy levels, we also characterize the risk of miss detecting the PU as High Risk, Medium Risk, and Low Risk regions, respectively. For analytical purposes, the risk regions for miss detecting the PU are defined by
-
(i)
high risk region (light user); for
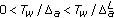 and
and 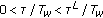 ,
, -
(ii)
medium risk region (average user); for
 and
and  ,
, -
(iii)
low risk region (heavy user); for
 and
and  .
.
 and
and  ,
, and
and  ,
, and
and  .
.
Spectrum occupancy levels of the primary user based on the Poisson arrival process.
In later sections, by using the detection probabilities derived from our theoretical analyses, we present numerical values for  , and
, and  .
.
3. Primary User Spectral Occupancy Statistics
To define the primary user's spectral occupancy statistics based on the Poisson arrival process we state (consider) some axioms. It is important to note that these axioms are the fundamentals in defining the Poisson arrival process in general, and based on these axioms we then analyze the spectrum sensing detection performances considering the spectral occupancy model of the PU. Let  be the number of times that the PU has been present in the network (number of transmissions) up to time
  , where
  , the axioms are then defined as in [46].
Axiom 1.
At time  the PU has got no occupancy of the spectrum at all. That is,
  .
.
Axiom 2.
Incremental independency and stationarity of  . That is, if
  and
and  for some
  such that
  , then
  and
and  are independent. Further, if
  , then
  and
and  have the same statistical distributions.
The Poisson distribution for the arrival process is then given by

where  and
and  is the mean arrival (spectral occupancy) rate of the PU. On the other hand, the occupancy time
  of the PU is initially considered to be a constant. Such a model essentially creates an M/D/1 arrival model considering a single CR and single PU system with a Poissonian arrival (M) and a deterministic (D) occupancy time. In later sections, we extend this to an M/M/1 arrival model by considering an exponential distribution and an M/G/1 model considering a Pareto distribution for the random occupancy time for the PU transmissions.
4. Spectrum Sensing
The spectrum sensing technique considered here is the signal envelope-based method [45] where the envelope of the signal is computed within a given range of frequencies in time and compared against a threshold value  . We consider the envelope-based detection method over the standard energy-based detection method [45, 48–50] mainly considering its simplicity in hardware implementation and computation. From the analytical framework we provide in this paper on the detection performance of the envelope-based detector, together with SoS of the PU, it is rather straight forward to derive the corresponding theoretical expressions for the energy-based detector and perform similar analyses to the ones that we present here. The Energy detectors in general including the envelope-based detector have drawbacks [10, 11, 49] for spectral occupancy detection especially when the noise power is not known, but on the other hand it is the simplest detection method when the CR node has got no knowledge about the PU transmission.
The received baseband signal of bandwidth  in its complex envelope form received over a time period of
  is given by

where,  is the complex envelope of the received signal from the PU without noise, and
  is the additive bandpass and band limited complex noise component associated with the sensing process. The additive noise
  is modeled as a zero mean complex Gaussian random process with a power of
  over a bandwidth
  . Note that in (3) we only consider the signal of our interest given within the frequencies
  and
and  (corresponding to the scanning time duration of
  ). Since we consider only one PU in our model, therefore
  corresponds to the signal received within the PU's transmission bandwidth. We also assume negligible fading associated with
  in our model or in other words the amount of fading is small considering the time period for computing the envelope (energy) of the signal, which is a valid assumption as there exist many cases with slow fading scenarios [51]. The envelope of the received signal at
  over a time of
  is used as the test statistic
  to detect the PU (transmitting in the frequency band between
  and
and  ), where
  is given by

Further more, we define the signal to noise ratio as  , where
  is the power of
  over the frequency band of
  to
to  given by

where  denotes the complex conjugate of
  . The generic detection criteria in deciding whether a PU is present or not for the m th scan, considering the sensing noise as well as the linear spectrum scanning process of the CR, is then given by,

Note that, as described in (6), we are only interested in the detection of a PU within the spectral range of  to
to  . The test statistic
  follows two different distributions under the hypotheses
  and
and  depending on whether the signal
  is present or not. From the signal model presented in (3), it is well known that [46] (since
  is complex Gaussian)
  follows a Rayleigh distribution under
  and a Rice distribution under
  , given by

where  is the time domain root mean square value of the signal
  , and
, and  is the zeroth order modified Bessel function of the first kind. The distributions in (7) are used to analyze the detection performance which we present in the subsequent sections.
5. Performance Analysis: Noiseless Sensing
The theoretical performance analysis for detecting the PU is performed in three stages. Initially, we study the detection performance considering only the SoS of the PU with a constant hold time with no sensing noise (i.e., SNR  ), then we extend the analysis considering the sensing noise, and then we further extend the analysis for random hold time. We also provide simulation results to support our theoretical analysis.
5.1. Theoretical Analysis
In the noiseless case, the detection performance of the CR node is characterized by the SoS of the PU, the bandwidth  of the PU, and the total time
  for the CR node to scan the entire bandwidth
  . As mentioned previously, we assume the CR nodes linearly scan the frequency in time over the desired (wideband) spectrum.
5.1.1. Occupancy Probability
For the PU, we define the spectral occupancy probability  as the probability of initiation of at least one transmission by the PU over a time of
  seconds. Therefore;
  is given by
  . From (2), we find a closed form expression for the probability of occupancy as

From (8), we can compute the spectral occupancy probability of the PU for a single scanning period  by letting
  .
.
5.1.2. Detection Probability
The detection probability, for detecting the PU by the CR node over a single scan duration of  , in the noiseless case is defined by the probability of initiation of at least one transmission within the time slot of
  for the m th scanning iteration (
 and
and  are defined in Section 2). The probability of detection is given by
  . Using the incremental independence and stationarity property of the arrival process (Axiom 2), we can rewrite
  as
as  , where
  , and from (2) we find a closed form expression given by

Note that when  , then
  . Therefore, the CR detects all the transmissions from the PU in a single scanning period. At the same time, we also observe from (9) that
  when
when  .
.
5.1.3. Miss Detection Probability
The probability of miss detection is defined by the probability that CR deciding  gives
gives  for a single scan. In other words, miss detection for the noiseless case occurs when there is at least one initiation of transmission occurring for some
  outside the interval
  , but no initiations (of transmissions) during the interval, in a single scan. Therefore, for a single scan the miss detection probability is given by

for some  and,
and,  , with
  . Since, the events occuring at
  and
and  in (10) are mutually disjoint,
  can be rewritten as
  . Again, using the incremental independence and stationarity property of the arrival process with (2), we find a closed form expression as

We further verify the analytical expressions for  and
and  , from (9) and (11), since
  .
.
5.1.4. False Alarm Probability
The false alarm probability for the noiseless case is defined by the probability of detecting a transmission given that no transmissions have been initiated by the PU during a single scan. Since we do not consider noise in this case, the probability of false alarm is simply zero. Further, we could verify this by expressing the false alarm probability as

and since  implies that
  , giving us
  , the probability of false alarm for the noiseless case becomes

5.2. Numerical Results
We present the simulation results in this section using Matlab to verify the theoretical analysis performed in Section 5.1 Simulations were performed using Monte-Carlo techniques to generate the random (Poisson based) PU's transmissions. In our simulations, the Poissonian arrivals are generated using the Binomial counting process by generating a binary random event with a probability of  within a small time duration of
  , as described in [46, Sectio
 21.3], which converges to a Poissonian process as
  with
with  . Simulations were performed in Matlab to generate the random arrival process with a deterministic hold time. Figure 3 presents the occupancy probability
  for various time durations
  . From the figure, we observe that
  increases with the arrival rate
  , as expected, and also marginally improves with the time duration
  . The figure shows how the the spectral occupancy probability of the PU (defined over a period of
  ) increases when the scanning duration
  increases for a given arrival rate
  . This observation is quite important, especially when we study the minimum time requirement (minimum
  ) for sensing the PU, which we present in the later sections. Figure 4 depicts the miss detection probability
  for various holding times
  and arrival rate
  . From the figures, we see that the detection performance at the CR node improves when both
  and
and  increase, we further observe that the improvement in the detection performance is greater when
  increases than when
  increases, relatively. From the figure we also see a very close match between the theoretical expressions derived in the previous section and the simulated results further verifying our analysis.

Occupancy probability of the PU versus the arrival rate
 for the Poisson arrival model for various time durations
 , with
 sec.
sec.

Probability of miss detection for the noiseless case with
 sec,
sec,
 MHz,
MHz,
 GHz.
GHz.
6. Analysis of the Primary User Miss Detection Risk Regions
In this section, we study the risk regions associated with miss detecting the PU depending on their SoS. Continuing from Section 2 and referring back to Figure 2, here we define the risk regions based on the probability of detection  (for the noiseless case). In other words, we define the values for
  and
and  based on the value of
  . Let us define two values for
  , given by
  and
and  . We define the
-
(i)
High Risk Region as the range of values for
 and
and  , for all values of
  such that
  ,
, -
(ii)
Medium Risk Region as the range of values for
 and
and  such that
  ,
, -
(iii)
Low Risk Region as the range of values for
 and
and  such that
  .
.
 and
and  , for all values of
  such that
  ,
, and
and  such that
  ,
, and
and  such that
  .
.Figure 5 shows the riskregions of miss detecting the PU by depicting a three-dimensional plot of for
for and
and with respect to
 and
and (for the noiseless case). The figure also shows the risk regions separated by two planes given by
 and
and that define the boundaries of the risk regions. The values of
  and
and can be varied depending on our traffic model (traffic sources) based on the application.

Probability of detection for the noiseless case with
 sec,
sec,
 MHz,
MHz,
 GHz.
GHz.
The values of  and
and  for the risk regions are basically custom defined and chosen to comply with regulatory requirements. For example, if the regulatory requirement for a minimum detection probability (to minimize interference to the PU) is given, then it could be assigned to
  . This would ensure that the low risk region (defined by
  ) does satisfy the regulatory requirements, which we explain in Example 1 later. On the other hand,
  which defines the medium and high risk regions is defined by the CR Network as a benchmark for classifying interference level as medium or high interference, respectively, (i.e., interference from the CR to the PU and vice versa).
Further, for a given set of values  ,
,  and
and  , we can define two theoretical curves
  and
and  for the boundaries of risk regions, which are given by

where  (from Section 5.1). The curves
  and
and  and the corresponding risk regions are shown in Figure 6. The figure here (Figure 6) defines the risk regions more precisely than Figure 2. Note that the risk regions can be custom defined based on the values of
  and
and  that define the curves
  and
and  , respectively. As observed in the figure, the risk regions become independent of the hold time
  for small values of
  . In practice, this is true since the detection performance only depends on the arrival rate
  for small values of
  . The values of
  and
and  defining the risk regions are then computed from
  and
and  , respectively as

For the parameters given in Figure 6, the values of  defining the risk regions are given by
  sec (for
  confidence, i.e.,
  ) and
) and  sec (for
  confidence, i.e., for
  ). The values
  and
and  , on the other hand, can only be defined for a given value of
  , letting
  to compute
  and
and  has no practical significance since when
  there are no transmissions from the PU. Therefore, for a given
  , say
, say  , we find the values of
  defining the risk regions by using
  and
and  (or by using Figure 6), as
  sec and
  sec.
sec.

Risk regions associated with PU detection, for
 sec,
sec,
 GHz,
GHz,
 MHz.
MHz.
Example 1 (WiMedia-UWB based Cognitive Radio System with Constant Scanning Time ( )).
)).
We now provide an example of a WiMedia based Ultra-Wideband (UWB) [7] CR system which requires a  confidence (
 ) in detecting a PU in the network. The PU system that we consider here is the WiMax radio [52] operating at
  GHz with a bandwidth of
  MHz and a transmission statistics derived by the Poisson process (Note: In practice the temporal behavior of WiMax transmissions may not be Poisson arrival process, however we consider the Poisson arrival here for analytical purposes). We analyze, for the noiseless case, the values of
  that enables the WiMedia based CR node to detect a WiMax PU with the given confidence level (
 ). We assume that the WiMedia system has an operational bandwidth of
  GHz (from 3 GHz–4.5 GHz) and a hardware that has a spectrum scanning time of
  msec (assumption only). Then, by using (15), we compute the value of
  for small values of
  , that defines whether the requirement of
  confidence for detecting the WiMax radio can be achieved or not in the noiseless case. Accordingly, we get
  where
where  . Therefore, given a fixed value
  , the CR can detect the PU with
  confidence for the noiseless case (or for very high received SNR of the PU signal) provided that the SoS of the PU is such that the mean time between transmissions
  satisfies
  sec for small values of
  .
.
7. Performance Analysis: Noisy Sensing
The detection performance with noise is of great interest to us. In this section, we analyze the overall probability of false alarm and the overall probability of miss detection for the envelope-based PU detection given the Poisson SoS of the PU for noisy sensing.
7.1. Theoretical Analysis
First, we define the four probabilities  ,
,  ,
,  , and
, and  for the noiseless case as,
  ,
,  ,
,  and
and  . From the analysis performed in Section 5, we identify that
  ,
,  ,
,  and
and  . Then, the overall probability of detection
  and the probability of false alarm
  for the noisy case are given by,

From (16), by using (7), we come up with two closed form expressions for  and
and  as
as

where,  is the Marcum
  -Function defined by,

From the expressions we, observe that the probability of false alarm  does not depend on the transmission statistics of the PU but only depends on the sensing noise. In the following section, we perform some simulations to study the detection performances and also verify the theoretical analysis performed in this section.
7.2. Complementary Receiver Operating Characteristic Curves and Simulation Results
The Complementary Receiver Operating Characteristic Curves (C-ROCs) for the envelope-based detector is presented here considering the PU transmission statistics. The C-ROC curve is the plot between  and
and  by varying the detection threshold
  . Together with the theoretical C-ROC curves, derived from the previous section, we also present some simulation results to verify our theoretical analysis. Monte-Carlo simulations were performed to generate the PU's (Poisson) transmission process and the noisy sensing process with Gaussian noise. Figure 7 shows the C-ROC curves for various SNR values for
  and
and  . As expected, we see that the C-ROC curves improve when the SNR is increased, the figure also shows the probability of miss detection (
 ) for the noiseless case as well. Figure 8 shows the C-ROC curves for different values of arrival rate
  with
with  dB and
  . From the figure, we observe how the detection performance improves when the arrival rate (spectral occupancy rate) of the PU is increased. Moreover, we see that when
  is increased further the detection performance predominantly depends on the sensing noise. Figure 9 shows the C-ROC curves for various values of spectral hold time
  for
for  and
and  dB. Improvements in the detection performances are observed when
  is increased but not as much as when
  is increased as in Figure 8. Furthermore, we clearly see that the simulation results very closely match with the theoretical results on all the figures, verifying our analysis in the previous section.

Complementary receiver operating Characteristics curves for various SNR values for the envelope based detector with
 GHz,
GHz,
 MHz,
MHz,
 sec,
sec,
 GHz,
GHz,
 (sec
(sec
 ),
),
 sec.
sec.

Complementary receiver operating characteristics curves for various arrival rates for the envelope based detector with
 GHz,
GHz,
 MHz,
MHz,
 sec,
sec,
 GHz,
GHz,
 dB ,
dB ,
 sec.
sec.

Complementary receiver operating characteristics curves for various holding times for the envelope based detector with
 GHz,
GHz,
 MHz,
MHz,
 sec,
sec,
 GHz,
GHz,
 (sec
(sec
 ),
),
 dB.
dB.
8. Performance Analysis: Random Hold Time
In our analysis so far we have assumed a constant hold time  . In this section we extend the analysis for the detection performance with a randomly distributed hold time
  . We consider two random hold time models namely (
 ) the exponential distribution which is a traditional way for modeling the call hold time describing many real time applications, and (
 ) the Pareto distribution which is used to model the World Wide Web IP traffic.
The exponential model is a very traditional model used to describe the random call hold time process. It is useful in modeling voice traffic as recommended by the ITU [32]. In [28], the exponential model is also verified experimentally for aggregated HSDPA data traffic by Telefonica I + D. Based on the type of traffic, the exponential model can also be extended to obtain further traffic models such as Erlange and Phase-type models [32]. However, in our paper, we adopt the exponential model whereas the other models could simply follow similar analytical procedures. We also adopt another model for the random hold time which suits modern teletraffic such as the World Wide Web IP traffic, namely, the Pareto distributed hold time model. The Pareto model is (experimentally) proven to fit Internet traffic as described in [28, 37, 53–56]. Furthermore, in practice, the analyses for the constant  with the M/D/1 model and the random
  with exponential and Pareto models are all useful depending on the type of traffic generated by the PU.
The exponentially distributed hold time  is given by the density function
  , with a mean hold time of
  . The Pareto distributed hold time
  is given by the density function
  for
for  and
and  , with
  for
for  and
and  for
for  . The parameter
  for the Pareto model describes the peaky nature of the density function and
  describes the minimum hold time that models a typical IP packet oriented service.
8.1. Theoretical Analysis
Using the exponential and Pareto hold time models with Poisson arrival for the PU transmission we rederive the expression for the probability of detection here for random  . The probability of false alarm
  stays unchanged, as in (17), because
  is independent of the transmission statistics of the PU (i.e.,
  is independent of
  ). From (17), we derive the new probability of detection for the random hold time by averaging over all possible values of
  . Therefore, the probability of detection is given by

(Note that for the Pareto model the integration range in the above is from  to
to  .) By solving the integral in (19) for both exponential and Pareto models, we come up with a closed form expression for
  as
as

where  is the probability of miss detection for the random
  in the absence of the sensing noise (i.e., considering only the transmission statistics of the PU), given by

Furthermore,the probability of detection  for random
  in the absence of noise is given by
  . The curves
  and
and  defining the risk regions (Section 6) can also be redefined for the random holding time case. From Section 8.1 we have two new curves for the exponential hold time model given by

The new curves in (22) differ mainly for low values of  but has the same limit values of
  and
and  defining the risk regions, as in (15), when
  .
.
8.2. Numerical Results
We compare the differences in the detection performance between the constant  and the random
  cases. The random
  case obviously relates to reality more than the former. Figure 10 depicts the theoretical curves for the probability of miss detection with respect to the arrival rate
  for the noiseless case. The figure shows both the constant and the random
  cases for the exponential and the Pareto models. As we observe from the figure, the differences between the two arise for higher values of mean hold time and
  . This is due to the fact that for larger values of
  and
and  , the probability of having smaller hold times is greater in the random case, and hence we observe poorer performances compared to the constant
  case. Figure 11 on the other hand shows the complementary ROC curves for the random and constant
  cases for noisy sensing. In Figure 10, we observed that the differences between the random and the constant
  detection performances arise for higher values of (both) mean hold time and
  , and in Figure 11 we observe that the difference between the two arise only when the SNR is higher, provided that the mean hold time and
  are high. For lower values of
  we see that the difference is negligible. Furthermore, we observe that Pareto model shows better detection performance compared to the exponential model based on the value of
  for the same mean hold time. Note that when
  increases the, Pareto model approaches the constant hold time case because the density function gets more peakier.

Probability of miss detection for the noiseless case with constant  and random exponentially distributed
  , for
, for  GHz,
GHz,  MHz,
MHz,  sec,
sec,  GHz.
GHz.

Complementary ROC curves with constant
 and random exponentially distributed
 , for
, for
 GHz,
GHz,
 MHz,
MHz,
 sec,
sec,
 GHz,
GHz,
 : Note: The
 values specified in the figure are for the constant hold time case, and
 values are for the random hold time case.
9. Minimum Required Spectrum Sensing Time
The temporal behavior of the PU influences the required spectrum sensing time for the CR node to reliably detect the PU. From the theoretical analyses performed in the previous sections, we study the minimum required sensing time to reliably detect the narrow band PU by a wideband CR node with a given confidence level. We compute the minimum required time for spectrum sensing based (only) on the temporal characteristics of the PU for both constant and random  cases. The advantages of knowing the minimum required sensing time
  here is two fold, (
 ) To reliably detect the PU with a given confidence level by not underscanning the spectrum (not scanning lower than the minimum required time) and (
 ) To save power at the CR node by not overscanning the spectrum (not scanning higher than the minimum required time), From (9) and Section 8.1, for a given confidence level of
  (i.e., probability of detection is
  ) for detecting the PU, the minimum required spectrum sensing time
  for the constant and random hold time
  cases are given by

The expressions in (23) can then be used by the CR nodes to dynamically adopt the spectrum sensing time  , given the hardware capability to adopt its time to sense, to reliably detect the PU, and at the same time save power. The temporal characteristics of the PU that is required to compute
  may be known a priori or be acquired by learning the environment at the CR node.
Example 2 (Minimum Sensing Time for WiMedia-UWB CR node for Detecting WiMax).
In this section we provide an example, continuing form Example 1 in Section 6, for a WiMedia-UWB based CR to detect a WiMax terminal with 90% confidence and the minimum required time to sense the spectrum. Note that, again here we assume as explained in Example 1 that the WiMax transmission has a Poisson arrival process.
Figure 12 shows the curves of  for 90% confidence in detecting the PU for both constant and random
  considering only the SoS of the PU (without noise). The figure shows the curves with respect to the arrival rate
  for various values of mean hold times. From the results; we observe that the minimum time required to sense the spectrum increases when the arrival rate (
 ) is low and as well as when the holding time is low. In the figure, we also show the operational region (for
  ) and the inoperational region (for
  ) of the CR nodes to reliably detect the PU (in the absence of noise). We further observe from the figure that the minimum sensing time
  reduces significantly when the hold time increases. Though the results shown in Figure 12 is for the noiseless case, it holds true for relatively high values of
  . Similar analytical curves also can be generated for the noisy case by following the above procedure.

Duration of the spectrum sensing time (
 ) requirement for 90% confidence in detecting the PU, based on the temporal characteristics of the PU, with
 GHz,
GHz,
 MHz.
MHz.
10. Conclusion
In this paper, we presented some detailed theoretical analysis on the performance of detecting a narrow band PU by a wideband CR terminal. The performance analyses were based on noisy sensing at the CR node as well as on the temporal characteristics of the PU. Closed form expressions were presented for the probabilities of detection, miss detection, and false alarm at the CR node, and were also verified using simulations. Further, we classify different risk regions for miss detecting the PU based on the temporal characteristics of the PU transmission, and consequently derive the minimum required spectrum sensing time to reliably detect the PU with a given confidence level. The analyses and the results were presented for both constant and random spectrum holding time, as well as random spectrum idle time considering the Poisson arrival process. Further research is to be conducted for optimizing the detection threshold for envelope- (energy-) based detection depending on the temporal characteristics of the PU together with the sensing noise. From the analytical framework that is provided in this paper, application (traffic) specific temporal (empirical) model for PU transmissions can also be used to perform similar analysis.
References
Mitola J III, Maguire GQ Jr.: Cognitive radio: making software radios more personal. IEEE Personal Communications 1999, 6(4):13-18. 10.1109/98.788210
Haykin S: Cognitive radio: brain-empowered wireless communications. IEEE Journal on Selected Areas in Communications 2005, 23(2):201-220.
Arslan H (Ed): Cognitive Radio, Software Defined Radio, and Adaptive Wireless Systems. Springer, Dordrecht, The Netherlands; 2007.
Hossain E, Bhargava V (Eds): Cognitive Wireless Communication Networks. Springer, New York, NY, USA; 2007.
Federal Communications Commission, Facilitating Opportunities for Flexible, Efficient, and Reliable Spectrum Use Employing Cognitive Radio Technologies, NPRM and Order ET Docket no. 03-322, December 2003
The Commission of the European Communities, Commission Decision 2007/131/EC on allowing the use of the radio spectrum for equipment using ultra-wideband technology in a harmonised manner in the Community Official Journal of the European Union, February 2007
Heidari G: WiMedia UWB: Technology of Choice for Wireless USB and Bluetooth. John Wiley & Sons, New York, NY, USA; 2006.
EUWB consortium, http://www.euwb.eu/
Kandeepan S, et al.: D2.1.1:Spectrum Sensing and Monitoring. EUWB Integrated Project, European Commissiona Funded Project May 2009., (EC: FP7-ICT-215669): http://www.euwb.eu/
Cabric D, Mishra SM, Brodersen RW: Implementation issues in spectrum sensing for cognitive radios. Proceedings of the 38th Asilomar Conference on Signals, Systems and Computers, November 2004, Pacific Grove, Calif, USA 1: 772-776.
Sahai A, Hoven N, Tandra R: Some fundamental limits on cognitive radio. Proceedings of the 42nd Allerton Conference on Communication, Control and Computing, September 2004, Monticello, Minn, USA
Cabric DB: Cognitive Radios: System Design Perspective, Ph.D. thesis. University of California, Berkeley, Calif, USA; 2007.
Wang P, Xiao L, Zhou S, Wang J: Optimization of detection time for channel efficiency in cognitive radio systems. Proceedings of IEEE Wireless Communications and Networking Conference (WCNC '07), March 2007, Kowloon, Hong Kong 111-115.
Amir G, Elvino SS: Opportunistic spectrum access in fading channels through collaborative sensing. Journal on Communications 2007, 2(2):71-82.
Quan Z, Cui S, Sayed AH, Poor HV: Wideband spectrum sensing in cognitive radio networks. Proceedings of the IEEE International Conference on Communications (ICC '08), May 2008, Beijing, China 901-906.
Lee W-Y, Akyildiz IF: Optimal spectrum sensing framework for cognitive radio networks. IEEE Transactions on Wireless Communications 2008, 7(10):3845-3857.
Cabric D, Tkachenko A, Brodersen RW: Experimental study of spectrum sensing based on energy detection and network cooperation. Proceedings of the 1st International ACM Workshop on Technology and Policy for Accessing Spectrum, 2006, Boston, Mass, USA
Aysal TC, Kandeepan S, Piesiewicz R: Cooperative spectrum sensing over imperfect channels. Proceedings of IEEE Globecom Workshops (GLOBECOM '08), November-December 2008, New Orleans, La, USA
Aysal TC, Kandeepan S, Piesiewicz R: Cooperative spectrum sensing with noisy hard decision transmissions. Proceedings of the IEEE International Conference on Communications (ICC '09), June 2009, Dresden, Germany
Wylie-Green MP: Dynamic spectrum sensing by multiband OFDM radio for interference mitigation. Proceedings of the 1st IEEE International Symposium on New Frontiers in Dynamic Spectrum Access Networks (DySPAN '05), November 2005, Baltimore, Md, USA 619-625.
Rashid MM, Hossain MdJ, Hossain E, Bhargava VK: Opportunistic spectrum access in cognitive radio networks: a queueing analytic model and admission controller design. Proceedings of the 50th Annual IEEE Global Telecommunications Conference (GLOBECOM '07), November 2007, Washington, DC, USA 4647-4652.
Pei Y, Hoang AT, Liang Y-C: Sensing-throughput tradeoff in cognitive radio networks: how frequently should spectrum sensing be carried out? Proceedings of the 18th Annual IEEE International Symposium on Personal, Indoor and Mobile Radio Communications (PIMRC '07), September 2007, Athens, Greece
Ma J, Li Y: A probability-based spectrum sensing scheme for cognitive radio. Proceedings of IEEE International Conference on Communications (ICC '08), May 2008, Beijing, China 3416-3420.
Tang S, Mark BL: An adaptive spectrum detection mechanism for cognitive radio networks in dynamic traffic environments. Proceedings of IEEE Global Telecommunications Conference (GLOBECOM '08), November-December 2008, New Orleans, La, USA 3009-3013.
Zhou X, Li Y, Kwon YH, Soong ACK: Detection timing and channel selection for periodic spectrum sensing in cognitive radio. Proceedings of IEEE Global Telecommunications Conference (GLOBECOM '08), November-December 2008, New Orleans, La, USA 2988-2992.
Kandeepan S, Rahim AB, Aysal TC, Piesiewicz R: Time divisional and time-frequency divisional cooperative spectrum sensing. Proceedings of the 4th International Conference on Cognitive Radio Oriented Wireless Networks and Communications (CROWNCOM '09), June 2009, Hannover, Germany
Kandeepan S, Giorgetti A, Chiani M: Time-divisional cooperative periodic spectrum sensing for cognitive radio networks. Proceedings of IEEE International Conference on Communications (ICC '10), May 2010, Cape Town, South Africa
Kandeepan S, Sierra A, Campos J, Chlamtac I: Periodic sensing in cognitive radios for detecting UMTS/HSDPA based on experimental spectral occupancy statistics. Proceedings of IEEE Wireless Communications & Networking Conference (WCNC '10), April 2010, Sydney, Australia
Jabbari B: Teletraffic aspects of evolving and next-generation wireless communication networks. IEEE Personal Communications 1996, 3(6):4-9. 10.1109/98.556473
Janevski T: Traffic Analysis and Design of Wireless IP Networks. Artech House, Boston, Mass, USA; 2003.
Allen AO: Probability Statistics, and Queuing Theory with Computer Science Applications. Academic Press; 1990.
ITU Handbook : Teletraffic Engineering, ITU-D. Study Group 2, June 2006, http://www.itu.int/
Park C, Shen H, Hernndez-Campos F, Marron JS, Veitch D: Capturing the elusive poissonity in web traffic. Proceedings of the 14th IEEE International Symposium on Modeling, Analysis, and Simulation of Computer and Telecommunication Systems (MASCOTS '06), September 2006, Monterey, Calif, USA 189-196.
Cao J, Cleveland WS, Lin D, Sun DX: Internet traffic tends toward poisson and independent as the load increases. In Nonlinear Estimation and Classification, Lecture Notes in Statistics. Volume 171. Edited by: Denison DD, Hansen MH, Holmes CC, Mallick B, Yu B. Springer, New York, NY, USA; 2003.
Salvador P, Pacheco A, Valadas R: Modeling IP traffic: joint characterization of packet arrivals and packet sizes using BMAPs. Computer Networks 2004, 44(3):335-352. 10.1016/j.comnet.2003.10.004
Mandjes M, Van de Meent R, Quija SN: Measuring modeling and cost allocation (M2C) project deliverable D2.1: a classification of IP traffic models. Project Report December 2003. http://arch.cs.utwente.nl/projects/m2c/
Zukerman M, Neame TD, Addie RG: Internet traffic modeling and future technology implications. Proceedings of the 22nd Annual Joint Conference on the IEEE Computer and Communications Societies, March-April 2003, San Francisco, Calif, USA 1: 587-596.
Karagiannis T, Molle M, Faloutsos M, Broido A: A nonstationary poisson view of internet traffic. Proceedings of the 23rd Annual Joint Conference of the IEEE Computer and Communications Societies, March 2004, Hong Kong 3: 1558-1569.
Krunz MM, Makowski AM:Modeling video traffic using M/G/
 input processes: a compromise between Markovian and LRD models. IEEE Journal on Selected Areas in Communications 1998, 16(5):733-748. 10.1109/49.700909
Neame TD, Zukerman M, Addie RG: Modeling broadband traffic streams. Proceedings of the IEEE Global Telecommunication Conference (GLOBECOM '99), December 1999, Rio de Janeiro, Brazil 1:
Fang Y, Chlamtac I, Lin Y-B: Modeling PCS networks under general call holding time and cell residence time distributions. IEEE/ACM Transactions on Networking 1997, 5(6):893-906. 10.1109/90.650148
Mah BA: Empirical model of HTTP network traffic. Proceedings of the 16th IEEE Annual Conference on Computer Communications (INFOCOM '97), April 1997, Kobe, Japan 2: 592-600.
Bolotin VA: Modeling call holding time distributions for CCS network design and performance analysis. IEEE Journal on Selected Areas in Communications 1994, 12(3):433-438. 10.1109/49.285304
Barcelo F, Bueno S: Idle and inter-arrival time statistics in public access mobile radio (PAMR) systems. Proceedings of the IEEE Global Telecommunications Conference, November 1997, Phoenix, Ariz, USA 1: 126-130.
Urkowitz H: Energy detection of unknown deterministic signals. Proceedings of the IEEE 1967, 55(4):523-531.
Kay S: Intuitive Probability and Random Processes Using Matlab. Springer, New York, NY, USA; 2006.
Wellens M, de Baynast A, Mähönen P: Performance of dynamic spectrum access based on spectrum occupancy statistics. IET Communications 2008, 2(6):772-782. 10.1049/iet-com:20070480
Kailath T, Vincent Poor H: Detection of stochastic processes. IEEE Transactions on Information Theory 1998, 44(6):2230-2259. 10.1109/18.720538
Tandra R, Sahai A: Fundamental limits on detection in low SNR under noise uncertainty. Proceedings of International Conference on Wireless Networks, Communications and Mobile Computing, June 2005, Maui, Hawaii, USA 1: 464-469.
Digham FF, Alouini M-S, Simon MK: On the energy detection of unknown signals over fading channels. IEEE Transactions on Communications 2007, 55(1):21-24.
Rappaport TS: Wireless Communications: Principles and Practice. 2nd edition. Prentice Hall, Upper Saddle River, NJ, USA; 2002.
Andrews JG, Ghsoh A, Muhamed R: Fundamentals of WiMAX: Understanding Braodband Wireless Networking. Prentice Hall, Upper Saddle River, NJ, USA; 2007.
Crovella ME, Bestavros A: Self-similarity in world wide web traffic evidence and possible causes. Performance Evaluation Review 1996, 24(1):160-169. 10.1145/233008.233038
Park K, Kim G, Crovella M: On the relationship between file sizes, transport protocols, and self-similar network traffic. Proceedings of the International Conference on Network Protocols, October-November 1996, Columbus, Ohio, USA 171-180.
Willinger W, Taqqu MS, Sherman R, Wilson DV: Self-similarity through high-variability: statistical analysis of Ethernet LAN traffic at the source level. IEEE/ACM Transactions on Networking 1997, 5(1):71-86. 10.1109/90.554723
Addie RG, Neame TD, Zukerman M: Modeling superposition of many sources generating self similar traffic. Proceedings of IEEE International Conference on Communications (ICC '99), June 1999, Vancouver, Canada 1: 387-391.
 input processes: a compromise between Markovian and LRD models. IEEE Journal on Selected Areas in Communications 1998, 16(5):733-748. 10.1109/49.700909
Acknowledgments
The research work was partly funded through the EU-FP7 Grant FP7-ICT-215669 under the EUWB Integrated Project. The authors would like to thank Professor Stephen Hanly from the University of Melbourne for his valuable comments.
Author information
Authors and Affiliations
Corresponding author
Rights and permissions
Open Access This article is distributed under the terms of the Creative Commons Attribution 2.0 International License (https://creativecommons.org/licenses/by/2.0), which permits unrestricted use, distribution, and reproduction in any medium, provided the original work is properly cited.
About this article
Cite this article
Kandeepan, S., Piesiewicz, R., Aysal, T.C. et al. Spectrum Sensing for Cognitive Radios with Transmission Statistics: Considering Linear Frequency Sweeping. J Wireless Com Network 2010, 123674 (2010). https://doi.org/10.1155/2010/123674
Received:
Revised:
Accepted:
Published:
DOI: https://doi.org/10.1155/2010/123674