- Research
- Open access
- Published:
Investigation of routing reliability of vehicular ad hoc networks
EURASIP Journal on Wireless Communications and Networking volume 2013, Article number: 179 (2013)
Abstract
In intelligent transportation systems, the cooperation between vehicles and the road side units is essential to bring these systems to fruition. Vehicular ad hoc networks (VANETs) are a promising technology to enable the communications among vehicles on one hand and between vehicles and road side units on the other hand. However, it is a challenging task to develop a reliable routing algorithm for VANETs due to the high mobility and the frequent changes of the network topology. Communication links are highly vulnerable to disconnection in VANETs; hence, the routing reliability of these ever-changing networks needs to be paid special attention. In this paper, we propose a new vehicular reliability model to facilitate the reliable routing in VANETs. The link reliability is defined as the probability that a direct communication link between two vehicles will stay continuously available over a specified time period. Furthermore, the link reliability value is accurately calculated using the location, direction and velocity information of vehicles along the road. We extend the well-known ad hoc on-demand distance vector (AODV) routing protocol to propose our reliable routing protocol AODV-R. Simulation results demonstrate that AODV-R outperforms significantly the AODV routing protocol in terms of better delivery ratio and less link failures while maintaining a reasonable routing control overhead.
1 Introduction
Recently, it has been widely accepted by the academic society and industry that the cooperation between vehicles and road transportation systems can significantly improve driver's safety and road efficiency and reduce environmental impact. In light of this, the development of vehicular ad hoc networks (VANETs) has received more attention and research efforts. Much work has been conducted to provide a common platform to facilitate inter-vehicle communications (IVCs) [1]. IVC is necessary to realize traffic condition monitoring, dynamic route scheduling, emergency-message dissemination and, most importantly, safe driving [2]. It is supposed that each vehicle has a wireless communication equipment to provide ad hoc network connectivity. VANETs are considered as a special class of mobile ad hoc networks (MANETs), yet they have several key features distinguishing them. Network nodes in VANETs are highly mobile, thus the network topology is ever-changing. Accordingly, the communication link condition between two vehicles suffers from fast variation, and it is prone to disconnection due to the vehicular movements and the unpredictable behaviour of drivers. Fortunately, their mobility can be predictable along the road because it is subject to the traffic networks and its regulations. VANETs have normally higher computational capability and higher transmission power than MANETs.
Those unique characteristics of VANETs raise important routing challenging issues that should be resolved before deploying these networks effectively [3]. The most challenging issue is potentially the high mobility and the frequent changes of the network topology [4, 5]. The topology of vehicular networks could vary when the vehicles change their velocities and/or lanes. These changes depend on the drivers, road situations and traffic status, and are not scheduled in advance. The proposed routing protocols and mechanisms that may be employed in VANETs should adapt to the rapidly changing topology. Besides that, they must be efficient and provide quality-of-service support to permit different transmission priorities according to the data traffic type. The existing routing protocols as they are designed for MANETs are not suitable for VANETs.
In this paper, we propose a new reliability based routing scheme to establish a more reliable route between the source and the destination nodes. The novelty of this work lies in its unique design of a reliable routing protocol that considers the mathematical distribution of vehicular movements and the link breakages. This work is based on the scenario, where vehicles move at a variant velocity along two directions on the highway. Extensive simulation experiments are performed to evaluate the performance of our proposed scheme in comparison to ad hoc on-demand distance vector (AODV) routing protocol. Packet delivery ratio, average number of link failures, average end-to-end delay and routing control overhead are the performance metrics considered in our evaluation process.
The rest of this paper is organized as follows: Related works summarizes the related works in this field. Background of vehicular communications briefs a background of vehicular communication technology. Vehicular reliability model presents the proposed vehicular reliability model and explains how our mathematical model is developed to get calculate the link reliability value. The reliability based routing protocol AODV-R explains our reliability based routing protocol AODV-R. Simulation setup and results presents the simulation scenario setup and results. Finally, Conclusion concludes the paper.
2 Related works
The literature on routing reliability mainly addresses MANETs (e.g. [6, 7]). For VANETs, Taleb et al. [8] propose a scheme that uses the information on vehicle headings to predict a possible link breakage prior to its occurrence. Vehicles are grouped according to their velocity vectors. When a vehicle shifts to a different group and a route involving the vehicle is to break, the proposed scheme searches for a more stable route that includes other vehicles from the same group.
In [9], the authors propose a velocity-aided routing protocol which determines its packet forwarding scheme based on the relative velocity between the forwarding node and the destination node. The region for packet forwarding is determined by predicting the future trajectory of the destination node based on its location information and velocity.
The authors of [10] present a prediction-based routing (PBR) protocol for VANETs. It is specifically designed for the mobile gateway scenario and takes advantage of the predictable mobility pattern of vehicles on highways. PBR predicts route lifetimes and preemptively creates new routes before the existing ones fail. The link lifetime is predicted based on the range of communication, vehicles' location, and corresponding velocities of vehicles. Since a route is comprised of one or more links, the route lifetime is the minimum of all its link lifetimes. PBR allows the processing of multiple routing requests to check all the available routes to the destination. If the source node receives multiple replies, then it uses the route that has the maximum predicted route lifetime.
The movement prediction based routing (MOPR) algorithm is proposed in [11]. This algorithm predicts the future position of the vehicle and searches for a stable route to avoid link breakage. If several potential routes between the source vehicle and the destination vehicle exist, MOPR chooses the route that is the most stable when considering the movement conditions of the intermediate nodes with respect to source and destination nodes. This is done using the location, direction and velocity information of each vehicle. An extension to the routing table in each node is needed to fulfill the requirements of this algorithm.
3 Background of vehicular communications
The development of VANETs is motivated by the desire to disseminate road safety information among vehicles to prevent accidents and improve the road safety. All data collected from the sensors on a vehicle can be displayed to the driver or sent to a road side unit (RSU) or be broadcasted to neighbouring vehicles depending on certain requirements [12]. Many more applications are proposed for vehicular networks besides road safety like car-to-home communication, travel and tourism information distribution, multimedia and game applications, and Internet connectivity.
3.1 The architecture of vehicular networks
As shown in Figure 1, the architecture of VANETs falls in three main categories
-
Inter-vehicle communication - This is also known as vehicle-to-vehicle (V2V) communication or pure ad hoc networking. In this category, the vehicles communicate among each other with no infrastructure support. Any valuable information collected from sensors on a vehicle, or communicated to a vehicle, can be sent to neighbouring vehicles.
-
Vehicle-to-roadside communication - This is also known as vehicle-to-infrastructure (V2I) communication. In this category, the vehicles can use cellular gateways and wireless local area network access points to connect to the Internet and facilitate vehicular applications [14].
-
Inter-roadside communication - This is also known as hybrid vehicles-to-roadside communication. Vehicles can use infrastructure to communicate with each other and share the information received from infrastructure with other vehicles in a peer-to-peer mode through ad hoc communication. Besides that, vehicles can communicate with infrastructure either in single-hop or multi-hop fashion depending on their position. This architecture includes V2V communication and provides greater flexibility in content sharing.

The architecture of vehicular networks [[13]].
3.2 The special characteristics of VANETs
Similar to MANETs, the network nodes in VANETs are self-organized and can self-manage information in a distributed fashion without a centralized authority or a server dictating the communication [14]. It means that nodes can act as servers and/or clients at the same time and exchange information with each other. Moreover, VANETs have unique attractive features over MANETs as follows [12]:
-
Higher transmission power and storage - The network nodes (vehicles) in VANETs are usually equipped with higher power and storage than those in MANETs.
-
Higher computational capability - Operating vehicles can afford higher computing, communication and sensing capabilities than MANETs.
-
Predictable mobility - Unlike MANETs, the movement of the network nodes in a VANET can be predicted because they move on a road network. If the current velocity and road trajectory information are known, then the future position of the vehicle can be predicted.
3.3 Challenging routing requirements of VANETs
Due to the special features of VANETs, the routing process is an important issue that needs to be addressed before these networks can be deployed effectively. Data packets are forwarded from the source node to the destination node using the available vehicles as relays. However, the expected large number of vehicles and the high dynamics and frequent changing of vehicles' densities raise real challenges for the routing process. Crossing, traffic lights and similar traffic network conditions cause frequent partitions in VANETs that make the routing process even harder. On the other hand, the design of the routing protocol in VANETs can benefit from features like mobility constraints and some kind of predictable mobility on roads. Moreover, the availability of other additional information such as geographical coordinates and city maps can be utilized.
According to [15], the current routing protocols proposed for VANETs can be classified into five categories: the flooding-based routing protocols that simply broadcast messages over the network; the mobility-based routing protocols, where the mobility information like relative distance, relative velocity, relative acceleration and directions of movement can be used to predict the lifetime/duration of the routing path; the infrastructure-based routing protocols, where the infrastructure such as RSUs, cellular base stations and even routine buses is used to help the robustness and security of VANET communications; the geographic location-based routing protocols, where VANETs can use global positioning system (GPS) location coordinates to find the routes that are geographically closer to the destination vehicle; and the probability-based routing protocols, where the probability theory is used to describe the likelihood of certain events like the probability of link breakage with a certain transmission power or a certain mobility parameter.
4 Vehicular reliability model
4.1 Highway mobility model
There are two major approaches to describe the spatiotemporal propagation of vehicular traffic flows [16]: macroscopic traffic flow models and microscopic traffic flow models. The macroscopic approach pictures the traffic flow as the physical flow of a continuous fluid. It describes the traffic dynamics in terms of aggregated macroscopic quantities such as traffic density p(x, t), traffic flow q(x, t) and average velocity v(x, t) as functions of space x and time t corresponding to partial differential equations. These parameters can be related together through their average values using the following relations [17]:
where dm is the average distance between vehicles in meters; ρveh is the traffic density on the freeway section considered in vehicles per kilometer; lm is the average length of vehicle in meters; τm is the average time gap between vehicles in seconds; vm is the average velocity of vehicles on the road in meters per second; and qm is the average traffic flow measured in vehicles per second.
On the other hand, the microscopic approach describes the motion of each individual vehicle. It models actions like the accelerations, decelerations and lane changes of each driver as a response to the surrounding traffic. It is known that the macroscopic approach can be used to describe both individual vehicle motion and general traffic flow status [18]. Hence, we use the macroscopic traffic flow model to describe the vehicular traffic flow and utilize the average velocity quantity to consider the mathematical distribution of vehicular movements over the traffic network. Moreover, the connection availability is determined based on the position, direction and velocity of each individual vehicle so the involvement of microscopic traffic flow model can improve the accuracy of the modelling. Thus, we propose a hybrid approach combining both macroscopic and microscopic traffic flow models as an improvement to [19], where we used only the macroscopic traffic flow model. The vehicular velocity distribution comes from the macroscopic approach, and each individual vehicle's movement is tuned using a microscopic approach to refine the prediction of its movement. Using this hybrid approach, we can obtain more accurate estimation of the link reliability between vehicles.
Based on the microscopic model, the movement of each vehicle i is defined by the following parameters: current Cartesian position at t: xi(t) and yi(t), current velocity vi(t), direction of movement αi(t) and acceleration ai(t). In VANETs, we consider that the vehicular velocity is the major factor in determining the expected communication duration between two vehicles. It is assumed that vehicular velocity has a normal distribution [20, 21]. The following relations describe the highway mobility model using the city section mobility model [9, 22]:
where Δ xb,c and Δ yb,c are the travelling distances along the x and y directions during time Δt = (tc − tb), ∂t is the time sampling interval between tb and tc, vik is the velocity of vehicle i at time instant k, and αik is the direction of movement of vehicle i at time instant k. Nevertheless, the acceleration/deceleration values have a uniform distribution, i.e. the values of vi(t + Δt) do not follow a normal distribution. One possible solution is to convert the uniform distribution of the acceleration/deceleration values to normal distribution using the Box-Muller transform [23] or the Ziggurat algorithm [24]. However, this solution is computationally expensive to apply and adds complexity to the routing algorithm. We propose a simpler solution to allow vehicles to accelerate or decelerate or keep the same velocity by picking a new normally distributed velocity value. Let Vset = {nv1, nv2,…,nve} be a set of normally distributed velocity values generated at t + Δt. Let nvL and nvS ∈ Vset, where nvL ≥ vi(t) and nvS ≤ vi(t). If the vehicle picks nvL, then it is accelerating; otherwise, it is decelerating by picking nvS. The drivers' behaviour parameter (DBR) is included in our proposed solution to distinguish between drivers who tend to accelerate over the average velocity and drivers who tend to decelerate. Thus, we rewrite Equation (4) as follows:
where U 1 is a random variable generated between 0 and 1. The DBR parameter value is set based on highway studies which suggest that about 75% of aggressive drivers tend to favour acceleration over a general mean velocity [10].
According to the classical vehicular traffic theory, vehicles are assumed to have Poisson distributed arrivals [17]. Thus, the time gaps between vehicles are distributed according to the following probability density function (pdf) [25]
where q is the traffic flow in vehicles per second. Based on Equation (8), the pdf of the vehicles' distance d can be written as follows:
where q is substituted by use of Equation (3), and lm is neglected to keep the mathematics simple. Hence, the distance between vehicles is exponentially distributed with the rate λ = ρveh/1,000, where d > 0. Nonetheless, the pdf in Equation (9) suggested replacing the velocity of vehicles with a constant average velocity vm which is not quite accurate according to the fact that velocities are variable because of the acceleration/deceleration while driving. However, this simple presentation of the pdf of vehicles' distance is suitable for our highway mobility model and simulation scenario design. More general and accurate distribution of the distance between vehicles has been investigated in [26].
4.2 Link reliability model
The link reliability is defined as the probability that a direct communication link between two vehicles will stay continuously available over a specified time period [27]. Given a prediction interval Tp for the continuous availability of a specific link l between two vehicles at t, the link reliability value r(l) is defined as follows:
In order to calculate the link reliability r(l), we utilize the vehicle's velocity parameter. The calculation of r(l) can be done in one part based on the assumption that the vehicular velocity has a normal distribution, i.e. if the velocities of two adjacent vehicles are unchanged or changed between t and t + Tp, the resulting relative velocity has a normal distribution. Let g(v) denote the probability density function of the velocity of vehicle v, and G(v) be the corresponding probability distribution function:
where μ and σ2 denote the mean and the variance of velocity v, respectively. The distance d between two vehicles can be written as a function of the relative velocity Δv and time duration T, d = Δv × T, where Δv = |v2 – v1|. Since v2 and v1 are normally distributed random variables, then Δv is also a normally distributed random variable and we can write Δv = d/T. Let H denote the radio communication range of each vehicle. The range where communication between any two vehicles remains possible can be determined as 2H, i.e. when the relative distance between the two vehicles changes from −H to +H. Let f(T) denote the probability density function of the communication duration T. We can calculate f(T) as follows:
where μΔv = |μv1−μv2| and σ2Δv=σ2v1 + σ2v2 denote the mean and the variance of relative velocity Δ v, respectively. We suppose that each vehicle is equipped with a GPS device to identify its location, velocity and direction information. Tp is defined as the prediction interval for the continuous availability of a specific link l between two vehicles Ci and Cj. We assume that vehicles will not change their velocities either by accelerating or decelerating during Tp. We also assume there is no separation distance between lanes carrying forward traffic and lanes carrying backward traffic. The width of the road is ignored for simplicity. The following cases are considered to calculate Tp accurately:
-
Vehicles are moving in the same direction
(13) -
Vehicles are moving in opposite directions
(14)
where Lij is the Euclidean distance between vehicles Ci and Cj, and vij is the relative velocity between vehicles Ci and Cj. Lij is calculated as follows:
where we assumed that Lij > 0, i.e. two vehicles cannot be at the same location at the same time.
We can integrate f(T) in (12) from t to t + T p to obtain the probability that at time t, the link will be available for a duration Tp. Thus, the link reliability value rt(l) at time t is calculated as follows:
the integral in (16) can be derived using the Gauss error function Erf[28]. It can be obtained as
where Erf is defined as follows
4.3 Route reliability definition
In vehicular networks, multiple potential routes could exist between the source vehicle sr and destination vehicle de, where each route is composed of a set of links (hops) between the source and the destination. Without loss of generality, for any given route, let us denote the number of its links as Ω: l1= (sr, n1), l2 = (n1, n2),…, lΩ = (nΩ, de). For each link lω (ω = 1, 2,…, Ω), we denote by rt(lω) the value of its link reliability as calculated in Equation (16). The route reliability for a route P, denoted by R(P(sr,de)), is defined as follows:
Suppose there are z potential multiple routes from the source sr to the destination de. If M(sr,de) = {P1, P2,…,P z } is the set of all those possible routes, then the optimal route will be chosen at the source node based on the following criteria:
In other words, if multiple routes are available, we choose the most reliable route that satisfies the reliability threshold determined by the application. It can be said that the route P is reliable if R(P) is greater than the reliability threshold, e.g. sensitive data needs more reliable route than other normal data. In this case, the reliability threshold for sensitive data could be R(P) > 0.9. A route could be reliable for some types of data to be transferred while it is not reliable for other types of data.
In conclusion, route reliability is a relative concept and depends on the data type to be transferred. If we have many routes that satisfy the reliability threshold, then we could choose the route that has the least number of hops.
5 The reliability based routing protocol AODV-R
For the purpose of evaluating our proposed reliability based routing scheme, we choose to extend the well-known AODV routing protocol [29] to propose our AODV-R routing protocol, where R stands for reliability. AODV is a reactive routing protocol, i.e. it establishes a route between the source node and the destination node only on demand. AODV can be used for both unicast and multicast routing. When a network node needs a connection, it broadcasts a routing request (RREQ) message to the neighbouring vehicles. Every node receives this RREQ will record the node it heard from and forward the request to other nodes. This procedure of recording the previous hop is called backward learning [14]. If one of the intermediate nodes has a route to the destination, it replies back to the source node with that route. If more than one reply arrives at the source node, then it uses the route with the least number of hops. If the routing request arrives at the destination node, a routing reply (RREP) message is sent back to the source node using the complete route obtained from the backward learning as illustrated in Figure 2.

AODV route discovery process [[5]]. (a) Propagation of the RREQ. (b) Path of the RREP to the source.
When a link breakage occurs, routing error messages (RERR) are generated to repair the existing route or discover a new one. AODV sends HELLO messages periodically to ensure the link is still active. In order to fulfill the requirements of our proposed reliability-based scheme, we extend AODV routing messages RREQ and RREP, and the routing table entries as follows:
-
1.
RREQ message is extended by adding five new fields to its structure as shown in Figure 3a
Figure 3 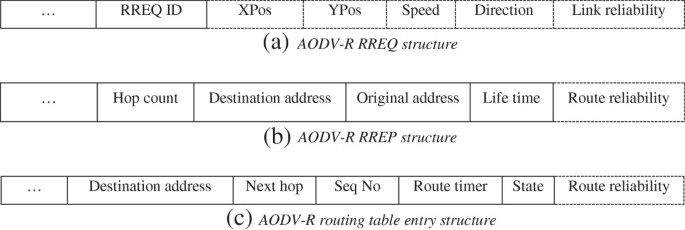
AODV-R data structure. (a) AODV-R RREQ structure, (b) AODV-R RREP structure, and (c) AODV-R routing table entry structure.
-
XPos, YPos contain the coordinates of the vehicle that generates/processes this RREQ.
-
Speed contains the current velocity of the vehicle that generates/processes this RREQ.
-
Direction contains the movement angle of the vehicle that generates/processes this RREQ.
-
Link_reliability contains the value of the link reliability between the sender and receiver of this RREQ.
-
-
2.
RREP message is extended by adding one new field to its structure as shown in Figure 3b
-
Route_reliability contains the final value of the whole route reliability between the source node and the destination node. This value is used by the source node to decide which route will be chosen in case of multiple routes between the source and the destination are found.
-

-
3.
Routing table is extended by adding one new field to its structure as shown in Figure 3c
-
Route_reliability contains the value of the route reliability of this route entry. This value is updated every time a route with a higher reliability value is found for the same destination.
-
5.1 Route discovery process in AODV-R
When the source vehicle sr has data to send, it first looks at its routing table. If there is a valid route to the destination de, then it will use it, else a new route discovery process starts. The source vehicle broadcasts a new RREQ message to the neighbouring vehicles and adds its location information, direction and velocity to this request. Once the RREQ is received by the neighbour vehicle, it calculates the link reliability to the sender vehicle based on Equation (16) and creates/updates a direct route based on the calculated link reliability value. After that, the link reliability value is updated by multiplying the calculated value and the saved value in RREQ message according to Equation (19). The new reliability value is then saved in the RREQ message. After that, the current vehicle will check if this RREQ is processed before or not. If it is, then we have a reverse route to the source vehicle. If the reliability value of this reverse route is less than the reliability value of the discovered one, it means that we have a new reverse route with better reliability value. In this case, the RREQ message will be processed again. Otherwise, it will be discarded. This mechanism allows the intermediate/destination vehicle to process multiple RREQs and send multiple RREPs to the source vehicle.
After finishing the creating/updating process of the reverse route, the current vehicle checks if it is the destination vehicle. If yes, then RREP message is sent back to the source vehicle with the final route reliability value. If it is not the destination, then it checks if it has an active route to the destination. If there is one, then it sends RREP message back to the source vehicle, else it forwards RREQ to other vehicles.
If the source vehicle receives multiple RREPs for the same RREQ, then it chooses the route based on the maximum reliability value among all received RREPs. In this way, we choose the most reliable route to the destination. The following chart in Figure 4 describes the processing of an incoming RREQ message in AODV-R at the intermediate/destination node.

Incoming RREQ process algorithm in AODV-R.
6 Simulation setup and results
We use the OMNet++ simulator [30] to conduct our simulation experiments and performance evaluation. OMNet++ is an extensible, modular, component-based C++ simulation library and framework, primarily for building network simulators. Since OMNet++ is a discrete event simulation package, we perform 15 runs for each simulation experiment to average our results and construct 95% confidence intervals to indicate the reliability of our simulation results. We compare the simulation results of AODV routing protocol with our proposed routing protocol AODV-R.
We have carried out a three-lane traffic simulation scenario of a 5,000-m highway with two independent driving directions for vehicles to move. The traffic density in each lane is 10 vehicles. When vehicles reach the end of the highway, they loop back in the same lane, i.e. the traffic is bidirectional. This gives more meeting opportunities for communications among vehicles and helps to improve the data delivery. The highway mobility model is implemented in OMNet++ and follows our definitions in Equations (4), (5), (6), (7) and (9). The average velocity of the vehicles for each lane is 40, 60 and 80 km/h, respectively. The velocity of vehicles is variable due to the different behaviour of drivers on the road. The reliability threshold R(P) = 0 for all the simulation experiments, i.e. the selection criteria at the destination will depend on the maximum reliability value. Figure 5 illustrates the simulation scenario.

Simulation scenario.
The following simulation experiments are performed:
-
1)
Experiment A - We change the average velocity of the vehicles in the third lane only from 60 to 140 km/h. The UDP packet size is 1,024 bytes. The transmission data rate is 10 packets per second.
-
2)
Experiment B - We change the data packet size from 500 to 3,000 bytes. The transmission data rate is 10 packets per second. The average velocity of vehicles for each lane is 40, 60 and 80 km/h, respectively.
In the following, the simulation results and confidence intervals are obtained via 15 simulation runs with one random stream seeded by the number of the corresponding run (from 0 to 14). This random stream is generated using the Mersenne Twister random number generator algorithm [31] that has the incredible cycle length of 2^19937-1. In addition, there is no need for seed generation because chances are very very small that any two seeds produce overlapping streams.
6.1 Performance metrics
The following four performance metrics are considered for the simulation experiments:
-
Average packet delivery ratio (PDR) represents the average ratio of the number of successfully received data packets at the destination node to the number of data packets supposed to be delivered.
-
Links failures represent the average number of link failures during the routing process. This metric shows the efficiency of the routing protocol in avoiding link failures.
-
Routing control overhead expresses the ratio of the total generated routing control messages to the total number of data messages supposed to be received.
-
Average end-to-end delay represents the average time between the sending and receiving times for packets received.
6.2 Effect of different velocities on the routing performance
Figure 6 shows that the proposed routing protocol AODV-R achieves higher packet delivery ratio than AODV. It is noticed that the average PDR reduces for both routing protocols when the average velocity in the third lane changes from 60 to 140 km/h. This reduction comes from the fact that the routing topology becomes more dynamic and unstable when velocity increases. However, the degradation of the PDR of AODV-R is less rapid than that of AODV. Choosing the most reliable available route makes AODV-R well adapted to the high dynamic vehicular environment. In AODV-R, when the source node receives multiple routing replies, it chooses the most reliable route and helps reduce the possibility of link breakages and the need for another route discovery process. Less route discovery processes means more bandwidth allocated for the data packets transmission.

Experiment A - average packet delivery ratio.
In Figure 7, the AODV-R shows higher average end-to-end delay values than AODV. The route establishment in AODV-R takes longer than that in AODV because of the processing of multiple routing requests and replies. However, the established route will be the most reliable one and will be used for a longer time. On the other hand, AODV chooses the shortest route to the destination regardless of its reliability. Thus, the route discovery process in AODV takes less time to find the route, but link breakages have a high probability of occurring. This is linked to Figure 6 that shows that AODV has a lower average delivery ratio than AODV-R especially when the velocity in the third lane exceeds 100 km/h.

Experiment A - average end-to-end delay.
When a link failure occurs, RERR message is generated for the purpose of repairing the current route or launching a new route discovery process. Figure 8 shows that AODV has higher average number of link failures than AODV-R. The shortest route selection algorithm in AODV is highly prone to link breakages when the network topology becomes more dynamic. On the other hand, AODV-R processes all the possible routes to the destination and chooses the most reliable one. For both AODV and AODV-R, the average number of link failures increases when the velocity increases. However, AODV-R responds better than AODV to the changes of the network topology and keeps a lower rate of link failures.

Experiment A - average number of link failures.
Figure 9 shows the average ratio of the routing control overhead for both AODV and AODV-R. The two routing protocols are affected by the changes of the network topology. In AODV-R, the routing algorithm uses more routing control messages to establish the most reliable route, so it is expected to have higher routing control overhead than AODV. However, the routing control overhead generated by AODV-R is reasonable and close to AODV generated overhead. The more link failures in AODV, as shown in Figure 8, the more new route discovery processes are issued. These extra route discovery processes generate more routing control overhead.

Experiment A - average routing control overhead ratio.
The Tables 1, 2, 3, 4 show the confidence intervals values for each figure in this experiment, where LL stands for lower limit and UL stands for upper limit.
6.3 Effect of different data packet sizes on the routing performance
In Figure 10, AODV-R always achieves higher PDR over different data packet sizes. Note that large packets may be fragmented. Any link breakages during the delivery process of a fragment of a data packet can cause the failure of the whole data packet delivery. If the delivery fails then a new route discovery process is needed to find a new route. More route discovery processes generate more routing control messages which consume bandwidth from the bandwidth available for data transmission. It is important to use the most reliable route to avoid the possibility of a link breakage during the delivery process of data packet fragments.

Experiment B - average packet delivery ratio.
In this experiment, Figure 11 shows that AODV-R also achieves higher average end-to-end delay than AODV. Although the route establishment in AODV-R takes longer than AODV, the established route will be the most reliable one and will be used for a longer time. On the other hand, AODV chooses the shortest route to the destination regardless of its reliability. Thus, the route discovery process in AODV takes less time. This is linked to Figure 10 which shows that AODV has a lower PDR than AODV-R.

Experiment B - average end-to-end delay.
In Figure 12, the average number of link failures in AODV is confirmed to be higher than AODV-R. This observation is illustrated in Figure 10, where the PDR of AODV-R is higher than that of AODV. The simple route selection algorithm in AODV has a high probability of link failures even though the network topology is not highly dynamic. AODV-R always searches for the most reliable route and keeps a low rate of link failures.

Experiment B - average number of link failures.
In Figure 13, the average routing control overhead ratio of both AODV and AODV-R are also close to each other as they were in Figure 9. The higher rate of link failures in AODV illustrated in Figure 12 causes more route discovery processes to be launched. These extra route discovery processes increase the routing control overhead. On the other hand, AODV-R still uses more routing requests and replies to establish the most reliable route but maintains acceptable levels of routing control overhead.

Experiment B - average routing control overhead ratio.
The Tables 5, 6, 7, 8 show the confidence intervals values for each figure in this experiment.
7 Conclusion
In this paper, we developed a link reliability model based on the vehicular velocity distribution on highways. A hybrid approach combining both macroscopic and microscopic traffic flow models is used in our highway mobility model. We applied the link reliability model to the routing process in VANETs to have a reliability-based routing scheme. We showed the advantages of using the link reliability model to improve the performance of the current routing protocol in VANETs. The vehicular reliability model is incorporated into AODV routing protocol to create our AODV-R routing protocol. The evaluation results reveal that AODV-R has a better delivery ratio compared to the conventional AODV since it chooses the most reliable route among all possible routes to the destination. Although the proposed AODV-R scheme has a slightly higher computational cost, it results much lower link failures while providing slightly higher average end-to-end delays than AODV.
The developed link reliability model considered the vehicular movements as the main cause for link breakages. Wireless channel congestion and/or noise errors [32] could be other possible causes for link breakages as well. The impact of wireless channel congestion/noise errors on the link reliability model and considering more routing constraints such as delay in our developed routing protocol will be our future extensions.
References
Jiang D, Taliwal V, Meier A, Holfelder W, Herrtwich R: Design of 5.9 GHz DSRC-based vehicular safety communication. IEEE Wirel. Commun 2006, 13(5):36-43.
Yang K, Ou S, Chen H, He J: A Multihop peer communication protocol with fairness guarantee for IEEE 802.16 based vehicular networks. IEEE Trans. Veh. Technol 2007, 56(6):3358-3370.
Moustafa H, Zhang Y: Vehicular Networks Techniques, Standards and Applications. Auerbach Publications Boston, MA, USA; 2009:7-11. 111–115, 145–148
Abdalla GMT, Abu-Rghef MA, Senouci SM: Current trends in vehicular ad hoc networks. Paper presented at the 1st international workshop UBIROADS’2007, Marrakech, Morocco 6 July 2007.
Blum JJ, Eskandarian A, Hoffman LJ: Challenges of inter vehicle ad hoc networks. IEEE Trans. Intell. Transport. Syst 2004, 5(4):347-351. 10.1109/TITS.2004.838218
Jiang S, He D, Rao J: A prediction-based link availability estimation for mobile ad hoc networks. Proceedings of IEEE INFOCOM 2001, Anchorage, AK 2001, 3: 1745-1752.
Thilagavathe V, Duraiswamy K: Prediction based reliability estimation in MANETs with Weibull nodes. Eur. J. Sci. Res 2011, 64(2):325-329.
Taleb T, Ochi M, Jamalipour A, Kato N, Nemoto Y: An efficient vehicle-heading based routing protocol for VANET networks. Paper presented at IEEE wireless communications and networking conference, Las Vegas, NV, USA 3–6 April 2006.
Feng KT, Hsu CH, Lu TE: Velocity-assisted predictive mobility and location-aware routing protocols for mobile ad hoc networks. IEEE Trans. Veh. Technol 2008, 57(1):448-464.
Namboodiri V, Gao L: Prediction-based routing for vehicular ad hoc networks. IEEE Trans. Veh. Technol 2007, 56(4):2332-2345.
Menouar H, Lenardi M, Filali F: A movement prediction-based routing protocol for vehicle-to-vehicle communications. Paper presented at the 1st international vehicle-to-vehicle communications workshop V2VCOM 2005, co-located with MobiQuitous 2005, San Diego, California, USA 21 July 2005.
Nekovee M: Sensor networks on the road: the promises and challenges of vehicular ad hoc networks and vehicular grids. Paper presented at the workshop on ubiquitous computing and e-research, Edinburgh, UK; 2005.
Kao J: Research interests. . Accessed (January 2013) http://www.cs.nthu.edu.tw/~jungchuk/research.html
Lee KC, Lee U, Gerla M: Survey of routing protocols of vehicular ad hoc networks. In Advances in Vehicular Ad-hoc Networks: Developments and Challenges. Edited by: Watfa M. Information Science Reference, Hershey, PA; 2009:149-170.
Yan G, Mitton N, Li X: Reliable routing in vehicular ad hoc networks. Proceedings of the IEEE 30th international conference on distributed computing systems workshops (ICDCSW), Genova, Italy; 2010. 2125–263269
Olariu S, Weigle MC: Vehicular Networks from Theory to Practice. Chapman & Hall/CRC, Boca Raton, FL, USA; 2009. pp. 46
Rudack M, Meincke M, Jobmann K, Lott M: On the dynamics of ad hoc networks for inter vehicle communication (IVC). Paper presented at the international conference on wireless networks (ICWN’02), Las Vegas, NV, USA 24–27 June 2002.
Kerner BS: Introduction to Modern Traffic Flow Theory and Control. Springer, Heidelberg; 2009.
Eiza MH, Ni Q: A reliability-based routing scheme for vehicular ad hoc networks (VANETs) on highways. Paper presented at the IEEE 11th international conference on trust, security, and privacy in computing and communications (TrustCom), Liverpool, UK 25–27 June 2012, 1578-1585.
Niu Z, Yao W, Ni Q, Song Y: Dereq: a qos routing algorithm for multimedia communications in vehicle ad hoc networks. In Proceedings of the 2007 international conference on wireless communications and mobile computing (IWCMC’07). ACM, New York, NY, USA; 2007. August 1216,– 393–398
Schnabe W, Lohse D: Grundlagen der Straßenverkehrstechnik und der Verkehrsplanung (Aufl. Verlag für Bauwesen, Berlin; 1997.
Davies VA: Evaluating mobility models within an ad hoc network, Colorado School of Mines, USA, 2000. . Accessed (January 2013) http://toilers.mines.edu/Public/Publications/Thesis/VanessaDavies.pdf
Box GEP, Muller ME: A note on the generation of normal random deviates. Analysis of Mathematics Statistics 1958, 29(2):610-611. 10.1214/aoms/1177706645
Marsaglia G, Tsang WW: The ziggurat method for generating random variables. J. Stat. Soft 2000, 5(8):17.
Leutzbach W: Introduction to the Theory of Traffic Flow. Springer, Berlin; 1988.
Yousefi S, Altman E, El-Azouzi R, Fathy M: Connectivity in vehicular ad hoc networks in presence of wireless mobile base-stations. Paper presented at the 7th Int. Conf. on ITS Telecommunication, Sophia Antipolis, France 6–8 June 2007.
Eiza MH, Ni Q: An evolving graph-based reliable routing scheme for VANETs. IEEE Trans. Veh. Technol 2013, 62(4):1493-1504. 10.1109/TVT.2013.2244625
Andrews LC: Special functions of Mathematics for Engineers. 2nd edition. McGraw-Hill, New York; 1992. pp. 110–112
Perkins CE, Royer EM: Ad-hoc on-demand distance vector routing. Proceedings of the 2nd IEEE workshop on mobile computing systems and applications (WMCSA’99), New Orleans, Louisiana, USA; 1999:90-100.
OMNeT++ Community, OMNeT++ network simulation framework. . Accessed May 2011 http://www.omnetpp.org/
OMNeT++ Community, New random number architecture. . Accessed October 2012 http://www.omnetpp.org/component/content/article/8-news/3533
Vinel A: 3GPP LTE versus IEEE 802.11p/WAVE: which technology is able to support cooperative vehicular safety applications? IEEE Wirel. Commun. Let 2012, 1(2):125-128.
Author information
Authors and Affiliations
Corresponding author
Additional information
Competing interests
The authors declare that they have no competing interests.
Authors’ original submitted files for images
Below are the links to the authors’ original submitted files for images.
Rights and permissions
Open Access This article is distributed under the terms of the Creative Commons Attribution 2.0 International License (https://creativecommons.org/licenses/by/2.0), which permits unrestricted use, distribution, and reproduction in any medium, provided the original work is properly cited.
About this article
Cite this article
Eiza, M.H., Ni, Q., Owens, T. et al. Investigation of routing reliability of vehicular ad hoc networks. J Wireless Com Network 2013, 179 (2013). https://doi.org/10.1186/1687-1499-2013-179
Received:
Accepted:
Published:
DOI: https://doi.org/10.1186/1687-1499-2013-179