- Research
- Open access
- Published:
Agent-based modeling of the cooperative spectrum management with insurance in cognitive radio networks
EURASIP Journal on Wireless Communications and Networking volume 2013, Article number: 261 (2013)
Abstract
We propose and numerically analyze an agent-based simulation model of the spectrum frequency trading mechanism, where the heterogeneous agents take on the role of primary users. The interactions with the demand of the secondary users are considered. The model is constructed on the basis of Bak-Sneppen model of coevolution where the extremal dynamics is used to activate the low profitable users. Here, the strategies of the primary users are coevolving. They are characterized by the spectrum prices and cooperation intensity levels. The primary users interact indirectly by means of the demand stimulation of the secondary users and an insurance pool, which is provided by the spectrum exchange management system. The existence of the insurance pool is motivated by the needs of avoidance of the financial losses. The simulation results indicate the reliability of the insurance mechanism. In addition, several notable phenomena have emerged from the interactions of agents. The price increase resulting from the spontaneously formed oligopolistic practices of agents is considered as the most emergent feature of the model.
1 Introduction
The frequency spectrum is a highly limited and an essential resource of wireless communication. With an increasing number of services densely utilizing the available frequency resources, the spectrum becomes heavily overcrowded. In order to alleviate such situation, an efficient system of exploiting of licensed frequency bands can be applied. The regulatory concept presented under the name cognitive radio has been introduced in [1] to make spatially and temporarily unused fragmented frequency bands usable and thus to improve the spectral efficiency.
The dynamic interaction in terms of free spectrum sharing among licensed (i.e., primary) and unlicensed (i.e., secondary) users provides additional benefits for both parties involved. The leasing of unused spectrum to the secondary users (SUs) constitutes an additional revenue for the primary users (PUs) [2]. On the other hand, the SUs are not obligated to sign a long-term contract with the state regulator and could opportunistically use the already available free frequency resources based on a short-term contact with no regulator requirements. This dynamic mediation among the PUs and SUs is referred to as the spectrum trading mechanism. Its constituents are spectrum trading and sharing processes. In the light of these trends in the organizational structure, it is expected that the market-driven cognitive radio environment will consist of a large number of PUs providing spectrum access to SUs in order to earn additional profit.
The PUs are potentially exposed to different forms of the technology and market risks. In case of technology risks, 'the incumbent operators are naturally favoring the harmonized approach (i.e. cooperation) since it decreases risks regarding the diffusion of the new technologies they have invested in and guarantees economies of the scale effects’ [3]. The market risk is mainly concerned with the price fluctuations and demand shocks.
The basic presumption of most of the previous models and studies is the strict distinguishing between cooperative and non-cooperative (selfish) regimes of the PUs involved in the market. In contrast, in our present paper the infinite variety of semi-cooperative or 'fuzzy’ cooperative behavior is taken into account. We are exploring the model of hybrid or fuzzy cooperation supplied by the adaptive actions related to the adjustment of cooperation level. The fuzzy cooperation expresses itself in the insurance mechanism, which accounts for systematic and also anomalously large losses caused by the stochastic nature of the cognitive radio market. These eventualities are covered by the compensation insurance policy. Note that the insurance mechanism in the cognitive radio context has already been postulated by Haiming et. al. [4] in case of SUs preventing the potential accident, i.e., transmission failure incurred by the excessively low signal-to-noise ratio (SNR).
Many different kinds of techniques describing the spectrum trading process have been introduced in order to make the spectrum trading scenarios nearly optimal given both PUs and SUs. Microeconomic approach, cooperative and non-cooperative game-theoretic framework, and analysis of spectrum auctions are now seen as essential steps in this direction. But for now, there are still many potential difficulties with the mentioned approaches due to the performance constraints on managing a large number of users in the market. As recent forecasts show [5], the main limitation will occur when ubiquitous wireless connectivity will be available, mobile devices will be the primary means for Internet access, and seven trillion wireless devices will have served seven billion people.
In order to provide a more holistic view of integrating the scientific ideas with technological demands, we adopt the agent-based modeling and simulation (ABMS) approach [6], which is able to capture the behavior of dozens of entities operating on the market. The first strength of ABMS consists of its ability to encompass the efforts and attributes of individual autonomous entities. They can be easily implemented and quite flexibly modified (reprogrammed) responding to immediate needs. The second strength involves the emergent behavior. According to [7] 'by modeling large number of interacting agents - each having the own objectives and characteristics and the ability to make decisions - complex macro-scale aggregate dynamics emerge.’ Observing the emergent behavior, new insights can arise from the results of simulations. The third strength is the relative simplicity and robustness of ABMS. ABMS reduces the complexity of the system control by replacing the aggregated outcome of a phenomenon, which is difficult to explain or to predict, mostly without applying complicated decision rules of self-aware entities at a lower level [7]. All the above attributes help the natural opening of the application of the ABMS into cognitive radio management.
Inspired and motivated by the success of ABMS in general, we introduce here an agent-based cognitive radio model based on the Bak-Sneppen model of coevolution [8] of species on local sites. In [9] the economic applications of this specific model has been discussed. An important note is that Bak-Sneppen model or its idea is not applied here to PUs as agent entities or species; instead, coevolving are their strategies composed of information about prices and cooperation membership. The cognitive radio model we suggest is primarily designed to a situation, in which a large number of PUs are interacting. The model embraces the complex scenarios, which cannot be simply extrapolated from the properties of its constituents. Since PUs are exposed to different types of operational perturbations, a sufficient level of robustness is necessary to ensure their dynamic stability. In addition, the safeness and reliability of the financial activity is also necessary for the efficient spectrum pricing. In this regard, the application of the Bak-Sneppen model can be seen as a blueprint of our thinking framework, partly justified by the fact that its evolutionary nature may provide a very robust shield against a wide class of perturbations.
The main contributions of the paper may be summarized as follows. In contrary to published works where mostly analytical formulations of the spectrum trading problem are discussed (refer to Section 2 for the literature overview), the research presented in this paper provides specific implementation of the ABMS modeling to the problem of the spectrum pricing. The model consists of the set of rules that regulate interactions, which yields eventually to the spontaneous formation of the partially oligopolistic market structure. This is perceived here as an emergent phenomenon identifiable via the price effects. The most significant is the interaction between PUs mediated by the demand of the SUs. Its variability causes the changes in profit, which stimulate Bak-Sneppen mechanism to modify the spectrum prices and levels of cooperation.
Another important contribution of the paper is the application of the insurance mechanism in the spectrum trading market. The novelty that is the underlying theme in all our work is that insurance contract needs not be permanently signed or executed, but is instead designed to allow each PU (consumer) to explore individual variable 'fuzzyfied’ participation (cooperation) in the unified and standardized insurance system. Thus, our model may be regarded as a specific model of the risk management in the cognitive radio network, which can be used to hedge against the risk of uncertain loss. The hypothesis about the partial elimination of the financial losses and financial risk elimination of the PUs has been supplied by our simulations. The dynamical model we propose introduces indirect financial form of interaction between agents mediated by the insurance pool. This arrangement of related agents may be considered (from the information flow modeling point of view) as an instance of message transfer infrastructure [10].
The paper is organized as follows. The overview of earlier work on the problem of spectrum trading is given in Section 2. The basic relations, which relate the demand of SUs to the profits of PUs of the presented model, are introduced in Section 3. The relations between spectrum demand of SUs to the profits of PUs are discussed. The simulation procedures, which describe the insurance policy, are presented in Section 4. The results and computational details are provided in Section 5, followed by the conclusions.
2 Related work
Current activities leading to the deregulation of the spectrum pose an additional question regarding the efficient spectrum resources’ sharing and trading. In general, the interaction among the PUs may be of the cooperative or competitive character. In case of competition, PU’s aim is to maximize their individual profits at the expense of profit reduction of other PUs [11–13]. When a coalition is formed, the cooperating PUs are aware of the situation of each other and their activities maximize the overall profit of the coalition [14].
In this regard, the problem of the spectrum trading among a PU and multiple SUs is discussed in [11]. Here, the interactions between participants is formulated as a non-cooperative game, and the static and dynamic aspects as well as monopolistic concepts are investigated. Stackelberg game jointly maximizing the utilities of the PU and SUs is introduced in [15]. The research outcomes presented in [11] are extended in [13, 16]. In the research work in [13], the scenario where multiple PUs are selling the spectrum opportunities to the group of SUs is investigated. Based on the behavior of the PUs, three different pricing schemes are discussed: (1) market equilibrium pricing scheme, (2) competitive pricing scheme based on the Bertrand model, and (3) cooperative pricing scheme. The main outcome from this work suggests that the cooperative pricing maximizes the total profit of all PUs involved on the market. The effect of dynamic perturbation (i.e., irrationality of the SUs) in the competitive pricing scheme is examined in [16]. The work by Duan et. al. in [17] shows that maximum profit loss due to the competition is not larger than 25% compared to the cooperative case. Further results on the cooperative behavior of the PUs are analyzed in [18].
Another type of interaction between the PUs is a collusion. The collusion among PUs in the competitive spectrum pricing scenario is investigated in [19]. In this work, the optimal pricing achieving the highest profit is adopted using the collusion contract among all participating PUs. In contrary, in [20] the pricing-based collusion-resistant dynamic spectrum allocation approach is proposed to optimize the overall spectrum efficiency not only for keeping the participating incentives of the selfish users but also combating the possible collusions.
The application of the portfolio theory in the cognitive radio markets is introduced by Wysocki et al. in [21]. The authors investigate the potential of portfolio theory to provide a framework for the spectrum management of QoS risk and reward in the wireless communication. New economic terms such as 'risk aversion’, 'risk-rewarded trade-off’, and 'economic welfare’ are introduced in relation to cognitive radio framework. We make use of the conclusion delivered in [21] and further elaborate on the concept of reduction of the risk aversion based on the insurance pool established by the PUs.
3 Cognitive radio model - demand and profit
In this paper, we adopt the exchange-based cognitive radio trading market scenario established in [22]. The authors introduce the particular interacting entities in the exchange-based model as follows:
-
1.
Spectrum exchange is an entity that provides and maintains a market place for bringing together the activities of the PUs and SUs. It also publicizes prices and anonymizes the trading entities. In this paper, we consider that the spectrum exchange acts as a pooling point that enables the delivery of wireless services through spectrum acquired by a buyer in exchange. Moreover, the spectrum exchange has no band manager functionality, i.e., it only facilitates the trading of the spectrum among entities in the market without holding any spectrum inventory itself. In addition to above - mentioned features, the spectrum exchange also maintains the insurance pool discussed later in the paper.
-
2.
Spectrum license holder is an entity that owns a spectrum license and offers it for trading in exchange for the financial compensation. In general, the spectrum license holder uses the spectrum to satisfy the subscribers who signed for the flat rate (i.e., primary connections) and the additional spectrum capacities are further re-sold to Spectrum license requesters.
-
3.
Spectrum license requester is an entity that submits bids for spectrum licenses with the intent to acquire the license. From now on, for the sake of clarity, Spectrum license holder and Spectrum license requester will refer to the wireless communication service providers to the PUs and SUs, respectively.
We consider a cognitive radio system with Npu PUs, where the i th PU owns the frequency spectrum of bandwidth W i (see Equation 7). The PU aims to sell the portion of the unused frequency bandwidth to the SUs (i.e., not allocated frequency channels in FDMA scheme). In this scenario, the offers to sell and the bids to buy the unused spectrum determines the winning bid and passes the spectrum usage from the PU to the SU. The initial handshake between the PU and SU is handled over the control channel through the spectrum exchange and after successful initialization (i.e., successful spectrum sharing and trading mechanisms negotiation), the PU allocates the frequency channel to the SU. Equilibrium demand of i th user is supposed in the form related to the utility u i
The relation is constructed to satisfy the following constraint on the total demand btot from the all SUs
Here we suppose that all spectrum needs of the SUs are ideally satisfied. The relation Equation 1 is adapted from the more frequently used probabilistic context, where normalization is required as well. To model the role of price and quality perception, we exploited formula u i ≡u i (k i ,p i )=wb,i(k i /p i )β where wb,i is the geographic preference for i th PU, k i /p i is the quality k i to price p i ratio. Such setting describes perfect rationality of SUs as β→∞, while the irrational behavior occurs for β→0. Furthermore, we use the intermediate choice β=1, which yields
The weighting wb,i simply expresses the fact that even in the case of the unique price and unique quality, there remains a preference beq,i∼wb,i caused by the unequal relatively persistent geographic conditions (i.e., localization of SU in the PU’s cell). The dynamics of the demand adaption to equilibrium value can be described by the model
Here the constant 1/abe represents the equilibration time. In the equivalent pseudocode style [6], we plan to use further the change in demand which is written as b i ←b i +abe(beq,i-b i ). The combining of Equations 3 and 4 implies the time invariance
In the business activities of firms, the profit (or more precisely gross profit) is defined as a difference between revenue and the component costs of delivered goods services. Regarding our specific interest to emphasize structure of the problem, we use the stylized form of the profit of the i th PU as
where b i p i is the revenue of PU and the quadratic term with PU specific parameter describes the costs due to underload or overload related to the spectrum utilization. In other words, the term means deviation of demand from the renting out capacity. The value (see also Equation 13) has been chosen on the basis of the calibration where the unique price of all PUs is supposed as starting point and the differences in demand thus stem only from the heterogeneous spectrum efficiency. One can see that the costs are proportional to the parameter(s) apr,i. The formula for pr i is a straightforward adaption of the well known and more comprehensive relation [11] for the profit of the quality of service performance
where W i is the spectrum size, is the bandwidth requirement per user, c1 and c2 are constant weights for the revenue and cost functions, M i is the number of primary ongoing connections, c1M i is the revenue gained from the primary connections served by the PUs, is the spectral efficiency of the wireless transmission provider for primary service i. We see that the revenue from the primary users is a linear function of the number of ongoing users. The quadratic term represents the cost due to the quality of service degradation of ongoing primary users due to sharing the radio spectrum with secondary service. The term arises when the required bandwidth cannot be provided.
The transformation of Equation 7 to Equation 6 can be simply obtained using
What is important here is that relation Equation 8 explains variable pr i (we are dealing with further), which characterizes the part of the profit free from c1M i term. The motivation for this step is that we want to study just the profitability related to sharing with SUs. In this way our model is less concerned with the determinants of active ongoing primary connections. The additional benefit from the above rescaling is that instead of specifying of numeric values W i , , M i , and separately, we have to specify only.
4 Insurance policy
In general, the role of the insurance system is a transfer of the risk from one agent to another. We suppose that in order to protect themselves against accidental and unpredictable loss, or provide a temporary respite from stagnation (characterized here by the profit returns), the PUs decide to establish the pooling fund (insurance trust).
The paper presents the theoretical arguments and simulations that show how the statistics of profits may be modified by the insurance under the unsteady price and demand conditions of economic environment. The insurance is the way in which the user can also better handle situations where a sudden unpredictable change in price and demand occurs. The application of insurance within the cognitive radio context could also be motivated by technological reasons. Some wireless communication systems must be built in disadvantaged areas with volatile consumer demands. The inequalities in terms of operation conditions require new thinking on risk assessment to attract PUs. Their freedom and flexibility, allowing reliable transition from the beginning of the insurance contract until its end, and vice versa, should be designed and maintained by modern wireless services.
We assume that financial transfers between PUs and insurance pool can be completely managed by the spectrum exchange entity. This cognitive radio component has been proposed in [22]. At each evaluation period, the PUs are required to provide automatic insight to their profit/loss statement. Let us assume that actual cooperation levels (characterized by co l , see section 'Insurance fee’ for details) of PUs are stored on the side of the spectrum exchange server. Using this specific information, the spectrum exchange server 'decides’ between the asking for an insurance fee or providing an adequate financial compensation.
4.1 Insurance fee
In this subsection, we postulate the computational steps related to the problem of insurance fee prinsu. The algorithm we suggested (a) requires to pay an insurance fee in the case of the positivity of the instant transformed profit pr l (i.e., no loss); it assumes prinsu>0 (the notation here ignores the subscript i); (b) assumes prinsu is proportional to the instant fuzzy cooperativeness (or fuzzy participation) parameter co l ∈ [ 0,1]; (c) assumes that fees collected from the PUs are accumulated in the insurance pool prpool>0. Thus, the adaptively varying expresses the instant ownership interest with respect to pool. The dynamic state variables changing with the insurance fee activity are comprised in the configuration tuple
The dynamics of its components is described by the following pseudocode

where l=1,2,…,Npu; the term unif [ 0,amodn] denotes the random number drawn uniformly randomly from the interval [ 0,amodn], where amodn>0 is the parameter of the drop in the cooperation level. The agent’s action co l ← max{ 0, co l -unif[ 0,amodn]} is exacerbated by unwillingness to pay the insurance fee. As we will demonstrate by simulations, the choice of the parameter amoup>0 affects the strengthening of insurance functions (motion up in co l ) and stabilization of indirect cooperation process via insurance. The rules in Equation 10 belong to decentralized fuzzy cooperation dynamics where each PU operates as a separate entity with actual co l shaped by the individual satisfaction, preferences, and insurance levels in the contracts.
4.2 Compensation policy and large loss policy
In this subsection we describe the rules for the management of the calculation of the compensation prcomp fee (which is again agent specific but denoted here without lower index) received by the PU recipients from the side of insurance provider. We suppose that the procedure is conditioned by the state pr l <0 (of l th user). The salient principles of the compensation we supposed are the following: (a) the fairness to insure in accordance to the level of cooperation and instant stage of the pool; (b) the supposition of the large compensation in the case of the rare instances conditioned by the sufficiency of the former level of the cooperation co l >acoth, where acoth is the threshold parameter; and (c) the willingness to develop cooperation caused by the gratitude due to actual compensation and perception of the insurance credibility. The details of the cooperation coordinated by the insurance depend on the random process determined by the parameters amodn,amoup, aco, and acoth (the role of the parameter amoup is the subject of thorough numerical simulation). We suppose the decisions of insurer are dependent on the instant mean cooperation level
The detailed information on the items of the insurance compensation process are captured by the pseudocode part

We see from here that compensation fee is considered to be proportional to the pool and the level of the cooperation co l . The constant aco/(Npucomean) is included in determination of prcomp due to normalization reasons. The fairness becomes partially confirmed when one reads Equation 10 showing that higher co l in the past yields higher fees prinsu=co l pr l into the insurance pool. However, it is important to recognize that fairness is harmed by delays (between the usage and accumulation of savings), fluctuations, and rare events. The updates described by Equation 12 also incorporate decision process where the management is concerned with compensation of the extraordinary large losses (-pr l )>prcomp, pr l <0. The protection of the insurance provider is controlled by the precaution parameter aco>0.
Let us turn to the particular question of the choice of the system of constants from Equation 6. Suppose that in order to get closer to the profit optimality (but not really the most precise adjustments), the PU makes preliminary (before signing a contract) recognition of the spectrum demands. The process may be formally associated with the setting of the constants , i=1,2,…,Npu. Suppose as well that they are determined under the idealized assumption about the uniqueness of the estimated price p i ≃pest. It causes the structure of Equation 3 admits factorization with the price-free result
4.3 The adaption of the Bak-Sneppen model of the coevolution
In part of our computational work, we are guided by the construction of the Bak-Sneppen model of the coevolution of interacting species. It was originally applied to exhibit the emergent phenomenon known under the notion of self-organized criticality. When applied to the extended populations of species, the model is capable to explain their universal features such as nontrivial power-law distributions of sizes of extinction events and phenomenon of punctuated equilibrium. The Bak-Sneppen model belongs to the models based on the extremal dynamics [23]. Here we are focused on the optimization potential of these models [24]. In the original formulation, the dynamics is suggested to repeatedly eliminate the least adapted species. This may be mutated, changed, or modified in some stochastic way in common with the changes imposed on the topological neighbors. The key factor driving the changes is the relative fitness of an agent (entity). When speaking about the Bak-Sneppen adaptations to the economic situations, the fitness may be naturally associated to the variations of the net profit. The survival of the spices/agents (PUs) can be related to the survival of the strategies of PUs and the topological relations (interaction network) of the species becomes equivalent to the financial interactions mediated by the demand of SUs.
In our scheme exploiting Bak-Sneppen model, the indirect interaction among PUs is mediated by the variable demand of SUs. The vector of the demands adjusts via the price vector . The reliable fitness represents the profit return
where the time labels (t) refer to the subsequent Monte Carlo steps t-1 and t. Now the different selection pressures may be considered. The objects of evolution are strategies contained in the following pairs
By borrowing from Bak-Sneppen model, we direct the evolutionary activity on selection of the lowest fitness entity of the index
The selection yields to the price update via the stochastic rule
where apm∈(0,1) is the price adaption parameter. The model describes the situation where the 'regressing’ agents want to avoid from the profit dropping. The Equation 17 guarantees price variation within the predefined bounds [ pdn,pup], pdn>0 under the simple assumption that the initial price value of the series also originates from the interval [ pdn,pup]. The PUs are obligated to accept the lowest and highest spectrum price in compliance with the requirements of the state regulation. The demand form Equation 2 supposes that all the SUs are satisfied independently of the price level and ability of pay. The SUs decide by giving preference to quality and price (the level of rationality is dictated by β) provided by certain PU. The feedback mechanism represented by Bak-Sneppen dynamics (Equation 17) then operates between the price setting and outputs of PUs. Thus, there is no bargaining on the spectrum price in the present version of the model. The assumption here is that extremal dynamics comprised in Equations 16 and 17 suits well for unpredictable market situations.
The choice of jmin corresponds to the agent expressing irrational financial unsatisfaction. To avoid the financial stagnation, the Bak-Sneppen type agent decides to change also its level of the cooperativeness according to stochastic rule
Beyond this extremal event is the belief that some different level of cooperativeness should guarantee higher profits.
The stochastic rule expresses the fact that stagnation changes are believed to be based on the motives of the cooperation in the positive or negative sense. The intensity of moves is defined by the constant parameter amoext. We see that the aspect of predictability and information about the behavior of the competitors (cooperators) is absent in this model. This property is used to mimic efficiency of the decisions and actions executed on the complex unpredictable financial markets where the information access is limited and the decision makers cannot recognize the courses of actions of other agents. One of the main purposes of our simulation approach is to test the robustness of the suggested system with very limited information exchange.
It should be noted that, if the level of profit pr i in Equation 16 (instead of prret,i) is chosen to control selection (coevolutionary changes), the dynamics will vary chronically the strategies of low-profit users (preferably those with small efficiency k i ). In contrast, the strategies of large PUs (having large k i ) remain unchanged. The preliminary simulation experience has shown us that such systems 'gets stuck’ close enough to some trivial modes (trivial attractors) with fluctuations coming only from frequent changes of the smallest users (PUs), but do not translate into major system changes (avalanches). Thus, we may suppose that systems coevolving on the basis of prret,i are more sensitive and more stirred up.
The situation with relative measure resembles that in survival of the small and large businesses. In the economic context, the relative measures of efficiency are known to be more reliable than absolute ones. Nevertheless, the 'rescaling’ we considered seems to us more appropriate for the modeling of the systems of different scale. Let us emphasize that the mentioned size differences are not present in the original Bak-Sneppen model.
4.4 Choice and potential impact of uniform generators
In summary, we can say that stochastic changes enter into the proposed simulation model in the form: (i) unidirectional updates of the cooperation level co l described by the Equations 10 and 12 and (ii) extremal dynamics updates involved in Equations 17 and 18.
Multitude of simulation studies exists where the generators of uniform distributions are commonly used. Their choice is usually considered to be a good starting point for systems where the actual distributions are not known or not simply deducible from elementary principles. In the case of Equations 17 and 18, the assumption of uniformity is in line with the original Bak-Sneppen coevolution model, where the local low fitness nodes (agents) are updated with uniformly distributed random values. It should be emphasized that assumption of uniformity in the extremal conditions does not mean that stationary distribution of fitness is also uniform. On the contrary, much less trivial distributions (with remarkable preference of large fitness values) emerge as a consequence of inherent nonlinearity. The argument in favor of the irrelevance of generated distributions is that stochastic updates are for many times less-frequent compared to the deterministic updates incorporated into the extremal dynamics scheme. It suggest that redistribution of fluctuations and formation of stationary distributions is prevailingly driven by nonlinearities.
The stochastic updates contained in Equations 10 and 12 are of different type. In this case, the use of uniform distribution is mainly for technical and simplistic reasons, because the resulting values of co l must be limited to 0≤co l ≤1. On the other hand, the two stochastic relations are built to maintain history and continuance in a value of co l since the 'new’ values are obtained from the 'old’ ones by adding random displacements.
4.5 High-level code description and holistic view of the algorithm
The aforementioned low-level computational items can be integrated into the high-level description which includes the following:

The main steps important for understanding of the whole dynamical system can be summarized as follows. The actual demands of PUs reflect filtered (or historical) values and actual competing prices and spectral efficiencies. The calculated demands for spectrum are then used to determine profits and profit returns. The ranking of profit returns yields further changes in the cooperation level due to extremal dynamics as a model used to simulate coevolution of PUs. The information about system state obtained allows updates of spectrum prices and cooperation levels of selected users with actually extremely low profitable strategies. The insurance system is pushing PUs to adapt their levels of cooperation (or fuzzy cooperation) according to the actual economic situation. The participation in the insurance coverage suppresses fluctuations in the profits by redistributing of the financial resources of the insurance pool.
5 Simulation results
We perform the iterative simulation of the system with Npu=10 characterized by the following set of parameters: abe=0.2, abe=0.2, apm=0.5, aco=1.7, amodn=0.002, acoth=0.15, acoext=0.05, pdn=0.1, pup=2, psd=0.05, btot=1, kmin=1, and kmax=2, for nonuniform settings and uniform apr,i=apr=6, wb,i=1, i=1,2,…,Npu. The simulation we are presenting here are primarily focused on the role of the parameter amoup for the creation and stabilization of the fuzzy cooperative insurance regime. We also study less intuitive side effects, which accompany this regime. Despite the above choice of the parameters is very specific, our extensive simulations show that scenario we proposed remains unchanged for sufficiently broad class of the model parameters.
The first simulation experiments have been applied to decide on the number of steps to simulate for given system size. Similarly as in other branches of simulation science [25], the number is deduced from nonstationary transition decay regime associated with the smearing of the information included in the initial conditions. Another simulation request is related mainly on the obtaining of the statistical features of the asymptotic steady-state regime. The optimization of simulation times yields simulation time MCtot=200,000 Monte Carlo steps (per system), where information from the initial MCini=5,000 steps is discarded in order to guarantee the initial stage is not captured by the estimates of the mean values. The steady-state regime may be described by means of the averages defined by
Here stdev (...) reads for the standard deviation and 1(cond) with the condition cond∈{true,false} is the indicator function such that 1(true)=1 and 1(false)=0. Such indication of the sign of events is of the special interest from the point of view of the insurance systems, where we search for the regimes which supplies elimination of the negative events.
The simulation outputs, which illustrate the dynamics and initial transition regime are depicted in Figures 1, 2, 3, and 4 (in the case of the prices the simulations are supplemented by their stationary distributions). The simulations show the typical patterns of the movements, which are signatures of the punctuated equilibria. It should be noted that analogous paths are typical for the models of self-organized criticality, to which the Bak-Sneppen model and its modifications/applications belongs.

The monitoring of the transition state showing the punctuated equilibria for the prices p 1 ,p 2 ,p 3 ,p 4 of four selected PUs. Calculated for amoup=0.02, amodn=0.002. We see that price moves as depicted are interrupted by seldom reorganizing events described by Equations 18 and 17(a,b,c,d). Similar bursts of activity are typical for all applications of Bak-Sneppen extremal rules. The time-dependencies are supplemented by the histograms constructed for p1 and p4. We see that distribution of prices comprises large and small peak (e,f). The peak presence has been verified using several independent simulation runs.

The transition regime of the cooperative parameter co l for all PUs l=1,2,…,N pu . The visible smearing of the initial condition. The uphill relatively fast moves are less visible than the slower downhill moves. One may estimate that the formation of the asymptotic steady-state regime corresponds approximately to 1,000 MCs.

The initial regime of . It verifies the positivity of pr pool in the coincidence with the rules imposed on the insurance policy.

The initial behavior of the profits of all PUs. Figure highlights radical coevolutionary change (nearly 1,100 MCs) with very high losses. Based on the similar observations we suggested averages of the type [p r-]av /[ p r+]av.

Important issue of the paper: cooperativeness is controlled by the parameter a moup . The computational details are presented in Equation 12. (top) We see that the parametric region 0.1<amoup<0.35 may be roughly associated with the vicinity of the critical point (amoup)crit. (bottom) Histograms of comean, which displays radical differences for distinct amoup. The differences in the skewness of comean histograms are present.
The main simulation findings stem from the statistical analysis obtained for the steady-state asymptotic long-term regime (see definition of averages in Equation 19. They can be summarized as follows:
-
1.
The mean level of the cooperation raises with the parameter a moup in agreement with the expectations and model formulation (see Figure 5). Interestingly, the simulations confirm very and interesting unexpected aspect of the proposed model, which is common for many systems of the interacting entities. It uncovers an existence of the threshold-type qualitative structure change of the systemic mean comean which may be associated with the critical or phase transition point in the parameter a moup. However, we must be cautious with this notion. It is used to characterize distinct forms - macrostates of the matter. In the narrow cognitive radio economics context, the phases are interlinked to differences in the collective behavior of PUs. It is believed that the phase transitions play an important role in the economics [26] or innovation management, but because of the lack of appropriate data it usually remains implicit. For instance, the phase transition in the field of economics may refer to the unexpectedly large variations when the exogenous conditions change. During the phase transition (radical change in the economic sense) of a given system, certain properties vary discontinuously as a result of the external (exogenous) condition, such as temperature. We study the model where exogeneity is related to the preferences and motivations described by the idiosyncratic parameter a moup that is not explainable within the proposed model. In the simulation we observe that the time average of the systemic mean comean increases with a moup. On the other hand, we see from Figure 5 that the characterization via [co]av is not sufficiently comprehensive because the histograms of comean are very broad and skew. More important for the classification and understanding of the observed phase transition seems to be the view that phases differ mainly in the risk and benefit distribution. For a given settings of parameters, we hypothesize that parameter (a moup)crit∼0.1 to 0.35 separates the phase (regime) of the low-cooperation a moup<(a moup)crit from the phase (regime) of the high-cooperation a moup>(a moup)crit. Further research is required to consider the role of fluctuations surrounding the critical point in greater detail.
-
2.
The essential feature accompanying critical behavior is that fluctuations are passing through all the system units (mainly because of demand of SUs), and thus they are reflected by many characteristics simultaneously, e.g., mean profits (see Figures 6 and 7). The particular confirmation of the criticality may be seen also in Figures 8 and 9.

The mean profit per primary user plotted against a moup . (top) The existence of the optimal mean (critical) profit is demonstrated. The profit increase may be perceived as a manifestation of the emergence of the oligopolistic (hidden) market. (bottom) The histograms indicate profound change in the equilibrium statistics of the instant systemic profits.

The dispersion of the profits as a function of a moup . In this case the position of the critical point can be defined by the threshold (approached from below) of this characteristics.

The mean price as a function of the parameter a moup . The mean price increase is interpreted as an emergence of the partially oligopolistic market. Clearly, the profits are increased at the expense of SUs. In our work we present arguments to support the proposition that price cusp roughly defines the critical point (phase transition).
-
3.
The dynamics at the vicinity of critical point yields higher coordination of PUs and more evidence on the convergence of the prices (see Figure 9), which suggests that oligopolistic coordination of the PUs emerges in a bottom-up self-organized way under the unconscious support of the common insurance authority - spectrum exchange server. It is worth mentioning that functioning of the spectrum exchange server needs storage of the actual values of prpool and co l .
-
4.
The differences in the stability of the insurance system are best reflected by the indicator [pr-]av/[pr+]av. This ratio of averages is mainly constructed to demonstrate an importance of the insurance service, which enables to absorb the financial losses (see Figure 10). The finding is consistent with the density plot (see Figure 11) showing the details of profit fluctuations.
-
5.
The model property reserves of the insurance pool are highly affected by the cooperation which is demonstrated in Figure 12. The model explains satisfactorily the simple fact that higher consumer’s trust in insurance increases insurance pool.
-
6.
In many of theoretical physics’s models exhibiting phase transitions, there exist well-established and objectively determined criteria how to extrapolate from the finite size towards asymptotic solutions [25]. When the numerical treatment is related to the 'new’ complex models, the criteria cause more problems since the numerical routine is not universally straightforward and thus the achievement of asymptotic regime may represent a time-consuming and difficult task. Therefore, in such cases we are usually in position to anticipate the view regarding the large finite-system sizes only.
The results of the calculations performed for Npu=10,20,40 are shown in Figure 13. In the figure caption we describe methodology consisting of the transition point estimate deduced from the 'bottoms of valleys’ of the averaged dispersions of [ stdev(p)]av(amoup) (or alternatively [ stdev(pr)]av(amoup)) dependence. The 'valleys, which gradually sharpen’ as the number of PUs goes up, are considered here to be symptomatic of the phase transitions.
Figure 9 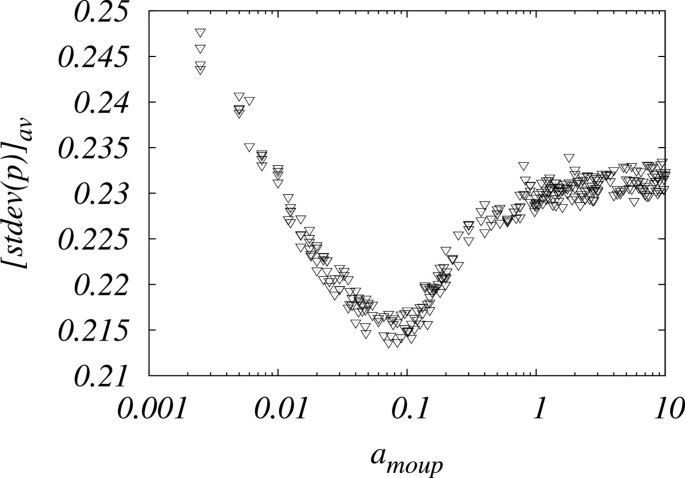
The mean dispersion of the prices. The remarkable influence of the cooperation of PUs on the price dispersion. The bottom of the valley may be associated with the phase transition.
Figure 10 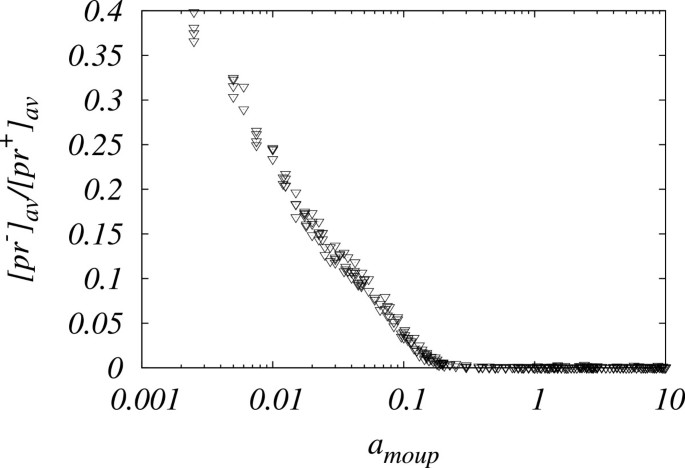
The ratio of averages demonstrates the absorption of the losses with a moup increasing. The qualitative change in the parametric space is remarkable. See Figure 11 where the shapes of the pr i distributions are given.
Figure 11 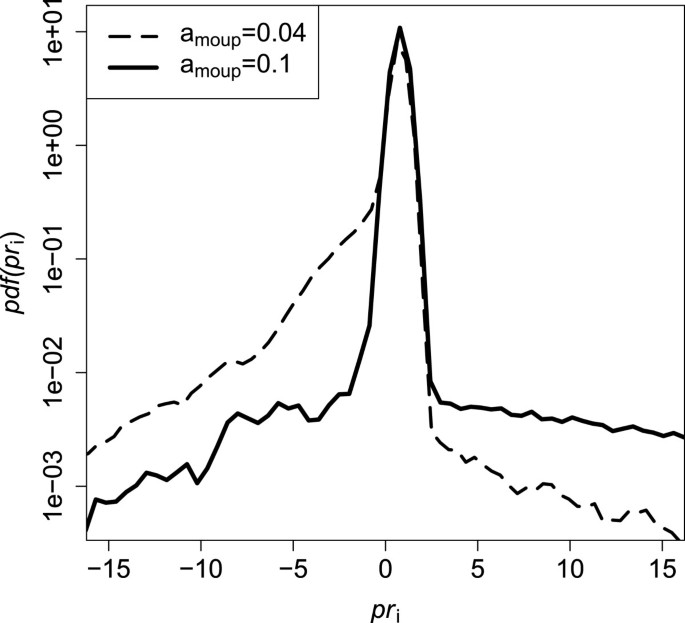
The essential achievement of the research on the design of the cognitive radio insurance system. Although the losses are very rare, the amount of money they spend can be very high. The density plot showing the profits and losses PUs caused by the different amoup. We see that partial absorption of the large losses can be achieved due to enhanced cooperation level. Initially, the density plot of the system with lack of the mean cooperation (comean≃0.17) is constructed for the parametric choice amoup=0.04. It is compared here with density plot corresponding to higher cooperation (comean≃0.24), which stems from the simulation at amoup=0.1.
Figure 12 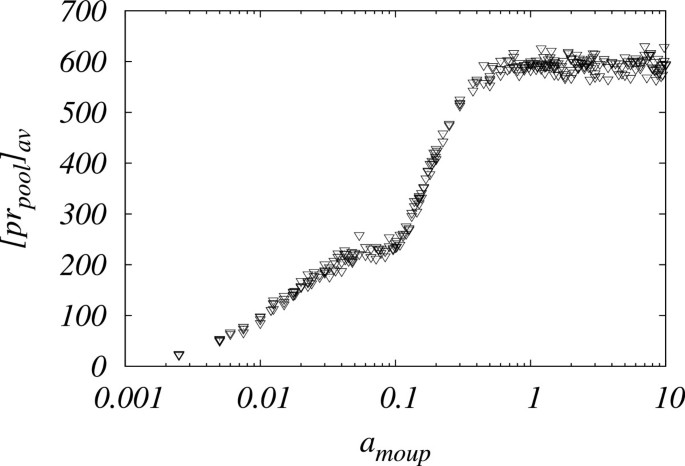
The simulation reveals an increase of the insurance reserves comprised in the insurance pool . The indirect multilateral cooperation is controlled by the parameter amoup.
Figure 13 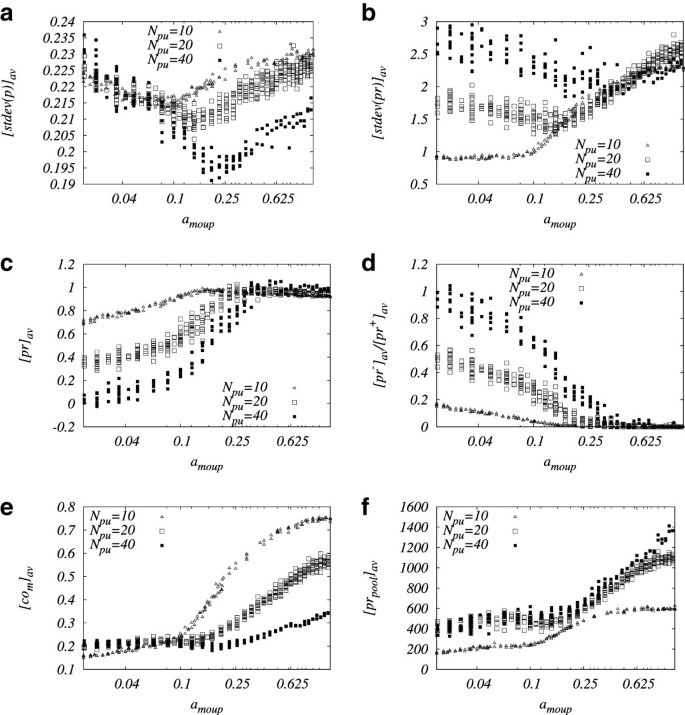
The preliminary analysis of the finite-size effects and phase transition scenario. The calculation has been carried out for Npu=10,20,40. The analysis of dependence [ stdev(p)]av(amoup)(a) yields rather small finite-size values (amoup)crit∼0.1 (for Npu=10), (amoup)crit∼0.14 (for Npu=20), (amoup)crit∼0.22 (for Npu=40) (these values are determined as bottoms of valleys). Much higher estimate ∼0.32 for Npu=40 stems from [ stdev(pr)]av(amoup)(b). In agreement with general point of view the simulations confirm that the form of statistical averages at the vicinity of the transition sharpen with Npu increasing. We can see that there are rather different characteristics with specific distinctions in the positions of the anomalies (valleys), which may serve as candidates for estimates of critical points (c,d,e,f). Because of the well-known technical difficulties in capturing of asymptotic value [25], we could not reliably determine (amoup)crit.


6 Conclusions
The emergence of the structures, patterns and unexpected properties, which cannot be directly deduced from the properties of the system definition, represents one of the strongest motivations that led us to perform an extensive agent-based simulation of the cognitive radio model supplemented with insurance service. In agreement with previous studies of the cognitive radio networks, we confirm that price of the service should increase with the level of cooperation, which leads to the higher costs for SUs. When seen from the perspective of the economic theory, the observed phenomenon may be identified as a formation of the oligopoly market. Despite the proposed computational model is of somewhat moderate level of the complexity, the dynamics it exhibits is beyond the scope of the familiar analytical formulations. The simulation demonstrates the possible benefits or attributes or costs resulting from the fuzzyfied access to the insurance system (degree to which PU agrees in its relations to other PUs), which prevents it from the unexpected (unpredictable) and large losses. The specific emergent phenomenon that we may pay attention to represents the cusp-shaped threshold in the parametric space. We presented arguments for the view that this threshold point may be associated with the phase transition, but the supposition needs more concentrated computational effort and theoretical understanding. On the basis of the preliminary investigations, we can state that the critical point separates two dynamic phases corresponding to different cooperative distributions. The location of the critical parameter has been briefly discussed from the point of view of the finite-size analysis (see e.g. [25]).
References
Mitola J, Maguire Jr. GQ: Cognitive radio: making software radios more personal. IEEE Pers. Commun 1999, 6(4):13-18. doi:10.1109/98.788210 10.1109/98.788210
Akyildiz IF, Won-Yeol L, Vuran C, Mohanty S, Mehmet: A survey on spectrum management in cognitive radio networks. IEEE Commun. Mag 2008, 46(4):40-48. doi:10.1109/MCOM.2008.4481339
Casey T: Analysis of radio spectrum market evolution possibilities. Commun. Strateg 2009, 75: 109-116.
Haiming J, Gaofei S, Sun G, Wang X, Zhang Q: Spectrum trading with insurance in cognitive radio networks. Proceedings of IEEE INFOCOM, 2012, Orlando, 25–30 March 2012 2041-2049. doi: 10.1109/INFCOM.2012.6195585
Uusitalo MA: Global vision for the future wireless world from the WWRF. IEEE Vehicular Technol. Mag 2006, 1(2):4-8. doi:10.1109/MVT.2006.283570
van Dam KH, Nikolic I: Agent-based modelling of socio-technical systems. Dordrecht: Springer; 2013.
Maenhoudt M, Deconinck G: Agent-based modelling as a tool for testing electric power market designs. Proceedings of the 7th International Conference on the European Energy Market (EEM), Madrid, 23–25 June 2010 1-5–23–25. doi: 10.1109/EEM.2010.5558780
Bak P, Sneppen K: Punctuated equilibrium and criticality in a simple model of evolution. Phys. Rev. Lett 1993, 71(24):4083-4086. 10.1103/PhysRevLett.71.4083
Bartolozzi M, Leinweber DB, Thomas AW: Symbiosis in the Bak-Sneppen model for biological evolution with economic applications. 2006, 365(2):499-508.
Weyns D, Parunak H, Michel F, Holvoet T, Ferber J: Environments for multiagent systems state-of-the art and research challenges. Lecture Notes in Computer Science 2005, 3374: 1-47. 10.1007/978-3-540-32259-7_1
Niyato D, Hossain E: Competitive spectrum sharing in cognitive radio networks: a dynamic game approach. IEEE Trans. Wireless Commun 2008, 7(7):2651-2660. doi: 10.1109/TWC.2008.070073
Niyato D, Hossain E: Competitive pricing in heterogeneous wireless access networks: issues and approaches. IEEE Netw 2008, 22(6):4-11. doi:10.1109/MNET.2008.4694168
Niyato D, Hossain E: Market-equilibrium, competitive, and cooperative pricing for spectrum sharing in cognitive radio networks: analysis and comparison. IEEE Trans. Wireless Commun 2008, 7(11):4273-4283. doi: 10.1109/T-WC.2008.070546
Maharjan S, Zhang Y, Gjessing S: Economic approaches for cognitive radio networks: a survey. Springer Wireless Pers. Commun 2010, 57(1):33-51. doi:10.1007/s11277-010-0005-9
Wang X, Ma K, Han Q, Liu Z, Guan X: Pricing-based spectrum leasing in cognitive radio networks. IET Netw 2012, 1(3):116-125. doi:10.1049/iet-net.2012.0149 10.1049/iet-net.2012.0149
Niyato D, Hossain E, Han Z: Dynamics of multiple-seller and multiple-buyer spectrum trading in cognitive radio networks: a game-theoretic modeling approach. IEEE Trans. Mobile Comput 2009, 8(8):1009-1022. doi:10.1109/TMC.2008.157
Duan L, Huang J, Shou B: Duopoly competition in dynamic spectrum leasing and pricing. IEEE Trans. Mobile Comput 2012, 11(11):1706-1719. doi:10.1109/TMC.2011.213
Cao B, Zhang Q, Mark JW, Cai LX, Poor HV: Toward efficient radio spectrum utilization: user cooperation in cognitive radio networking. IEEE Netw 2012, 26(4):46-52. doi:10.1109/MNET.2012.6246752
Niyato D, Hossain E: Competitive pricing for spectrum sharing in cognitive radio networks: dynamic game, inefficiency of Nash equilibrium, and collusion. IEEE J. Selected Areas Commun 2008, 26(1):192-202. doi:10.1109/JSAC.2008.080117
Zhu J, Liu KJ: Multi-stage pricing game for collusion-resistant dynamic spectrum allocation. IEEE J. Selected Areas Commun 2008, 26(1):182-191. doi:10.1109/JSAC.2008.080116
Wysocki T, Jamalipour A: Spectrum management in cognitive radio: applications of portfolio theory in wireless communications. IEEE Wireless Commun 2011, 18(4):52-60. doi:10.1109/MWC.2011.5999764
Caicedo CE, Weiss MBH: The viability of spectrum trading markets. IEEE Commun. Mag 2011, 49(3):46-52. doi:10.1109/MCOM.2011.5723799
Moukarzel C, Duxbury PM: Failure of three-dimensional random composites. J. Appl. Phys 1994, 76(7):4086-4094. 10.1063/1.357358
Boettcher S, Percus A: Nature’s way of optimizing. Artif. Intell 2000, 119(1–2):275-286.
Binder K, Heermann DW: Monte Carlo Simulation in Statistical Physics. Heidelberg: Springer, Berlin; 2002.
Maslov VP: Mathematical economics and thermodynamics: crises as phase transitions. Math Notes 2009, 86(6):879-882. doi:10.1134/S0001434609110303
Acknowledgements
Authors thank agency VEGA for support through the projects 1/0506/13 and 1/0973/11.
Author information
Authors and Affiliations
Corresponding author
Additional information
Competing interests
The authors declare that they have no competing interests.
Authors’ original submitted files for images
Below are the links to the authors’ original submitted files for images.
Rights and permissions
Open Access This article is distributed under the terms of the Creative Commons Attribution 2.0 International License (https://creativecommons.org/licenses/by/2.0), which permits unrestricted use, distribution, and reproduction in any medium, provided the original work is properly cited.
About this article
Cite this article
Horváth, D., Gazda, V. & Gazda, J. Agent-based modeling of the cooperative spectrum management with insurance in cognitive radio networks. J Wireless Com Network 2013, 261 (2013). https://doi.org/10.1186/1687-1499-2013-261
Received:
Accepted:
Published:
DOI: https://doi.org/10.1186/1687-1499-2013-261