- Research
- Open access
- Published:
Autonomous pipeline monitoring and maintenance system: a RFID-based approach
EURASIP Journal on Wireless Communications and Networking volume 2015, Article number: 262 (2015)
Abstract
Pipeline networks are one of the key infrastructures of our modern life. Proactive monitoring and frequent inspection of pipeline networks are very important for sustaining their safe and efficient functionalities. Existing monitoring and maintenance approaches are costly and inefficient because pipelines can be installed in large scale and in an inaccessible and hazardous environment. To overcome these challenges, we propose a novel Radio Frequency IDentification (RFID)-based Autonomous Maintenance system for Pipelines, called RAMP, which combines robotic, sensing, and RFID technologies for efficient and accurate inspection, corrective reparation, and precise geo-location information. RAMP can provide not only economical and scalable remedy but also safe and customizable solution. RAMP also allows proactive and corrective monitoring and maintenance of pipelines. One prominent advantage of RAMP is that it can be applied to a large variety of pipeline systems including water, sewer, and gas pipelines. Simulation results demonstrate the feasibility and superior performance of RAMP in comparison to the existing pipeline monitoring systems.
1 Introduction
Pipeline networks are the indispensable part of our modern life. Proactive monitoring and frequent inspection are critical for maintaining pipeline health such that safe and efficient functionalities of pipelines can be sustained for a longer period. Early pipeline monitoring systems were developed with a wired network. The primary use of a wired network is to connect and communicate with sensors scattered through the pipelines. This technique has a number of problems such as network failure tolerance, physical security in large scale, and difficulty in locating and accessing [1, 2]. To overcome these problems, a solution based on network redundancy to address fault-tolerance is given in [2]. However, this solution may not be scalable with the network size and bandwidth, and it does not consider sensor fault-tolerance. In recent years, sensor networks have witnessed a rapid growth due to the development of inexpensive sensing devices and communication technologies and are used for several applications such as agriculture, military, health care, and pipeline monitoring. Several sensor network-based pipeline monitoring systems have been proposed in the literature, e.g., [1, 3–7]. However, these systems are passive in the sense that they do not perform corrective activities and only report on incidents. Therefore, robot agent-based technologies are considered as an attractive alternative for fully/semi-autonomous pipeline monitoring and inspection. Moreover, robot agent-based technologies free the engineers from the confinement of pipeline inaccessibility, environment hazardousness, and system scalability. Therefore, a number of robot agent-based techniques have been studied in the literature, both manually controlled [8–14] and semi-autonomous/autonomous [15–17].
Existing sensor- and robot agent-based pipeline monitoring systems rely on some form of localization method to locate events and support motions of the sensors/agents, e.g., signal triangulation [4], signal cross-correlation [6], beacon interpolation [18], number of wheel rotations [15], pipe-joint location and counting [19], EM-sonde locating [19], and blueprint of the pipeline [17]. As outlined in Table 1, these methods exhibit several shortcomings related to efficiency and cost-effectiveness in monitoring pipeline systems. In fact, an efficient localization method would provide controllable errors in the sense that the localization can be performed as per the error threshold requirement of the pipeline system. In addition, the major components (the sensors and agents) of any pipeline monitoring system should have the capacity to use localization to work independently and be able to collaborate to achieve monitoring efficiency.
The Radio Frequency IDentification (RFID) technology has recently been used in many areas for different tasks, for example, it is used in automobile industry for processing tracking, in warehouses for resource management, and in livestock industry for tracking animals, and this technology has been gaining significant attention in the recent days.
Based on these observations, we propose in this article a novel RFID-based Autonomous Monitoring system for Pipelines, called RAMP, which combines sensor- and robot agent-based technologies with RFID technology for the very first time for event (incident) localization and proactive and corrective monitoring of a large spectrum of pipeline types including water, sewer, and gas pipelines. The localization of RAMP is efficient as well as cost-effective since it uses low-cost passive objects serving as markers. Our localization solution builds on a concept, denoted as Multiple-channeled Redundant Array of Independent RFID Tags (McRAIT), which is used to collect, store, and locate the information about events, and also to provide fault-tolerance for the collected information. RAMP also relies on tasks performed by High-Performance Mobile Sensors (HPMS) and Fully Autonomous topology-aware Mobile Pipeline Exploration Robots (FAMPER [20–22]).
Our contribution, in this article, is fivefold:
-
We propose a RFID-based localization technique which can be applied to a large variety of pipeline systems. It allows controllable localization errors because the threshold it reaches is controlled by a fixed fraction of the distance separating two successive localization markers.
-
We introduce a new structure for a powerless storage system using McRAIT to increase detectability, storage capacity, and fault-tolerance of tags and communication.
-
We design a scalable mobile sensor architecture which integrates a number of sensing functions, a configurable transmission function, and communication functions with McRAIT.
-
We design a prototype of an autonomous robot which has different sensing functions for detailed inspection and special actuators for repairing activities on the detected incidents. It uses tilted caterpillars to overcome motion singularity problems [14] that may occur in the several pipeline bends (e.g., T- or Y-bends).
-
We show the cost-effectiveness, scalability, and good performances of our pipeline monitoring system based on our RFID-based localization technique of mobile sensors and incidents, powerless storage system using McRAIT, and autonomous robot.
We proceed as follows: Section 2 provides the state of the art on the sensor- and robotic agent-based pipeline monitoring and maintenance systems. Section 3 discusses the requirements for the efficient pipeline monitoring system and provides a high-level overview of RAMP. Section 4 describes the McRAIT system design. Section 5 discusses the event localization technique, and Section 6 discusses the complete design of the RAMP system. The performance of RAMP is given in Section 7, and Section 8 concludes the article with a short discussion.
2 State of the art
We first describe sensor-based pipeline monitoring systems and then summarize existing robot agent-based approaches. Table 1 compares the main characteristics and limitations of the previous work and also compares our solution with them.
2.1 Sensor-based pipeline monitoring systems
A sensor network platform developed by Jin and Eydgahi [4] for pipeline monitoring uses acoustics sensing devices such as Lead Zirconate Titanate (PZT) sensors. This solution is based on the transmission and detection of lamb waves and uses a simple triangulation method for event localization. It exhibits several drawbacks. First, the acoustic sensors are customized to the structure of the pipeline which is not appropriate for other types of pipeline technologies. Second, the topology of the pipeline is made very simple, making the localization technique inefficient for complex pipeline topologies.
A wired/wireless sensor network architecture is used by Jawhar et al. [23] and Mohamed and Jawhar [1] to provide fault-tolerant communication between sensing nodes fixed to the pipeline and the main control station. The wired part of the network is considered as a primary network, while the wireless part is only used for its backup in case of communication failures. While this architecture addresses reliability issues of the wired network, the solution does not include a model providing an optimized management of the energy assigned to sensor nodes (i.e., nodes closer to the control station consume more power than the other nodes) and does not integrate clearly a localization mechanism.
PipeNet, a wireless sensor network proposed by Stoianov et al. [6], integrates sensors that are able to generate acoustic vibration and collect hydraulic and acoustic/vibration data at high sampling rates. This system detects leakage and locates it via cross-correlation of acoustic/vibration signals. In addition to the drawbacks of [4], the uniformity of the liquid characteristics is a must requirement for the efficient localization in PipeNet. Moreover, GASNET due to Schempf [7] is a self-powered wireless network of keyhole-installed and keyhole-replaceable sensors capable of measuring and communicating pressure, flow, and vibration in natural gas distribution system pipelines. Comparing to aforementioned systems, it only provides replaceability of the sensors and most of their limitations still remain.
Several systems have been proposed in the literature to monitor pipelines using mobile sensors, e.g., [5, 18, 24, 25]. The basic idea is to use mobile drifting sensors to (a) monitor the pipeline, the liquid flowing in the pipeline, and the chemicals generated inside the pipeline; (b) provide close monitoring of the different areas of the pipeline; and (c) generate and transmit event-related data when it observes failing statuses (through beacons, for example). But a major drawback of this mobile sensor technique is the inefficiency in accurately locating incidents due to the lack of mobility and the communication network of the drifting sensors.
PipeProbe [18] is a mobile sensor system used to map water pipelines hidden within cement walls or under floor coverings. The system is composed of a small sensor capsule that is dropped into the water pipelines to periodically collect and store data such as accelerometer readings and water pressure information. Using these data, the system tries to reconstruct the 3D spatial layout of the traversed water pipeline. The major drawback of this method is the inaccuracy of the collected data and the uncontrolled correlation between linear and rotational speeds. In addition, the sensors can experience vibrations, which may produce noisy 3D accelerometer readings.
SewerSnort [5], an in-sewer gas monitoring system, uses floating sensors for sewer gas concentration measurement. The floating sensors are introduced at the upstream station and collect location-based gas measurements as they travel downstream (our system RAMP also uses this technique). The collected data is used to visualize gas exposure, allowing efficient maintenance and/or repair. The localization of events is through fixed beacons set up on the manholes in the pipeline structure. This generates large errors (in our system, it is controlled through tags installed uniformly inside the pipeline). Furthermore, floating sensors’ ability to measure the gas exposure is limited by the drastic reduction in gas concentration due to the flow level of the transported liquid.
Murphy et al. [3] developed a wireless network system in which an underwater team of “Collaborative Autonomous Agents” (CAAs) is able to locate and repair scale formations in pipelines and tanks. However, this solution is limited to the detection and repair of very specific scale formations.
Recently, Meribout [24] proposed a secure wireless sensor network-based infrastructure for the detection of eventual leaks in multiphase pipelines, i.e., the pipelines which carry more than one fluid. This technique is based on having the pipeline which carries the fluid be surrounded by another pipeline which can hold the leak detection unit. It uses an air-ultrasonic sensor and a bidirectional microphone to determine the location of the leak. However, the need of two layers makes this solution uneconomical for long-distance pipelines, and also the localization may not be fairly accurate due to the amount of noise involved in communication. Moreover, this solution does not provide proactive monitoring of pipeline health and requires high topology maintenance cost (e.g., battery power).
Similarly, Sun et al. [25] proposed a magnetic induction (MI)-based wireless sensor network framework to provide a real-time leakage detection and localization for monitoring underground pipelines. It detects and localizes leakage by jointly utilizing the measurements of different types of sensors that are located both inside and around the underground pipelines. However, this technique does not fit for low-cost inspection as it needs various sensors both inside and outside the pipelines. Moreover, it has high topology maintenance cost and does not provide proactive monitoring.
In 2005, Pure Technologies Ltd. developed a mobile sensor technology, SmartBall [26], to address the need for leakage detection on large-diameter pipelines. SmartBall is designed to operate in live large-diameter water mains. It has a free-swimming foam ball with an instrument-filled aluminum alloy core capable of detecting and locating small leakages (generally, gas pocket leakages) in pipelines using its acoustic sensor and sound-generating beacons that are installed along with pipelines. Typically, SmartBall provides location accuracy within 10 feet and 15 miles of inspection range with a single drop. However, in order to calculate the location of SmartBall, it needs to install sound-generating beacons which need power and installation outside the pipeline. Moreover, it requires beacon infrastructure maintenance since they need a power supply and can cause high installation cost for beacon installation in the case of underground pipelines.
2.2 Robot agent-based pipeline monitoring systems
Robot agent-based systems are considered as an attractive alternative of sensor-based systems described in the previous subsection for the fully autonomous real-time pipeline inspection and monitoring. For natural gas distribution pipelines, Schempf et al. [27, 28] proposed EXPLORER and GRISLEE that provide the visual inspection of 4-, 6-, and 8-in-diameter pipelines. Although EXPLORER and GRISLEE have comparably good mobility in elbows and T-branches of the pipelines, the inspection using EXPLORER and GRISLEE is cost-expensive and time consuming as the robot itself is responsible for the inspection of the entire pipeline. Moreover, these systems provide no mean for incident localization. Several other robot agents are proposed for inspecting different diameter pipelines, e.g., [8–14]; we direct readers to respective papers for details and only summarize their limitations here. It is worth noticing that these robots are manually controlled and experience several limitations including the following two facts: (i) the topology of the pipeline, where some of them have been used, was made simple and does not have vertical segments and Y- and T-branches; and (ii) the robots exhibit localization problems due to several reasons including wheel slips and undetectability of the markers. Some researchers developed semi-autonomous and autonomous solutions [15–17]. KANTARO [15] is an autonomous mobile robot used for the inspection of 200–300-mm-diameter sewer pipelines. It uses a simple moving mechanism which reduces resource usage. However, the localization based on wheel rotations is not efficient because a wheel slip can induce large errors on the location computation. MAKRO [17] is another fully autonomous, untethered, multi-segmented, and self-steering articulated robot. It is designed for inspecting roughly cleaned, non-man-entry sewer pipes with a diameter of 300–600 mm at dry weather conditions. Similar to KANTARO, MARKO’s localization technique is not efficient, and it does not have vertical mobility. In addition, certain assumptions such as dried pipelines are not suitable for real-time operations [17].
3 RAMP overview
3.1 Requirements for efficient monitoring and maintenance
A pipeline monitoring and maintenance system should perform three main activities: inspecting pipeline health regularly, reporting incidents, and recovering pipeline health from any leakage, damage, or corrosion. Costs of those activities keep increasing, as well as the scale of pipelines. Thus, a cost-effective and scalable pipeline monitoring and maintenance system should be able to fulfill the following requirements:
-
Scalable: The system should adapt to varying topologies and also be independent to pipeline characteristics (e.g., shape, size).
-
Customizable: It should be a generic solution for different applications and be extensible to meet the requirements of more complex pipelines without requiring major changes in the underlying architecture or design.
-
Dynamic: The system should allow dynamic inspection of the pipeline and real-time reaction to problems detected during inspection and provide robust performance to cope with the variability of problems that may occur.
-
Proactive monitoring and recovery actions: The system is able to find defects in the pipelines, preventing failures and allowing rapid repairing.
-
Autonomous: The major components of the system should work independently yet collaboratively and perform their tasks autonomously. They should have sufficient energy to perform their duties without relying on external energy.
-
Cost-effective: The system should reduce the costs of maintaining and monitoring pipelines.
-
Optimized energy consumption: The system components should provide efficient communication with low energy consumption. Actions involving information management, computation, and recovery should also be optimized for power saving.
-
Efficient localization techniques: Efficiency calls for a distributed system in which entities are aware and able to locate incidents with controllable errors.
3.2 The pipeline monitoring and maintenance problem
The pipeline monitoring and maintenance problem we consider in this paper can be formulated as follows. Let P be the pipeline system that needs to be monitored. Let P ud be the portion of P between an upstream station and a down pumping station; we focus on P ud in this paper, and the approach for P ud can also be used for the monitoring and maintenance of remaining portions of P. There might be incidents such as leakage and corrosion in P ud . We have given the error threshold e T such that the difference between the location of an incident reported in the inspection process by any pipeline monitoring and maintenance system and actual location of that incident should not differ by more than e T . Therefore, the objective in this problem is to monitor P ud such that the incidents are located with error less than e T and repair actions can be taken on the incidents.
3.3 High-level description of RAMP
RAMP combines sensor- and robot-based technologies with RFID technology for the very first time for the proactive monitoring and localization of events in different types of pipelines. We use a set \({\mathcal {S}}=\{s_{1},\ldots,s_{l}\}\) of l≥1 mobile sensors to locate the incidents which will be injected to P ud from the upstream station. Moreover, to perform repairing actions, we use a set \({\mathcal {R}}=\{r_{1},\ldots, r_{m}\}\) of m≥1 robot agents which will also be injected to P ud from the upstream station. The sensors are collected at the down pumping station and only after processing the information collected by them, the robot agents will be injected to the pipeline, if detailed inspection and repair actions are needed. For the localization of the incidents within the error threshold e T and also for the localization of each sensor s i (and each robot agent r i ), we use a set \({\mathcal {F}}=\{f_{1},\ldots \}\) of localization markers (RFID tags) which will be installed inside the pipeline in certain intervals. We show later that the distance separating two localization markers directly depends on the smaller of the following two values: (i) the half of the transmission range of the RFID reader attached to the mobile sensor; (ii) the distance d separating any mobile sensor s i from the next RFID tag in its way, to have the error within e T on the reported incidents and also on the localization of sensors (and robot agents) inside the pipeline (during the inspection process).
RAMP has three major components. The first component of RAMP is the specially designed RFID tags, called the Multiple-channeled Redundant Array of Independent RFID Tags (McRAIT) system, for the set \({\mathcal {F}}\). It is implemented by a passive RFID tag. McRAIT uses multiple tags and multiple frequencies to improve storage capacity, detectability, and tolerance to loss of information. Each tag in the array is allocated to a specific radio channel as depicted in Fig. 1 a so that all tags in the array can be accessed simultaneously. McRAIT is used for providing the location and incident information within the pipeline topology to the mobile sensors as well as robot agents. McRAIT installation can be performed initially (at the construction of the pipeline) or when needed by the pipeline operation. In the latter case, the robot agent will be used to set up the needed McRAITs.

Design of a McRAIT and b HPMS
The second major component of RAMP is the specially designed mobile sensor, called High-Performance Mobile Sensor (HPMS) (depicted in Fig. 1 b), for the set \({\mathcal {S}}\), which is equipped with different kinds of inspection capabilities that allow it to play different roles simultaneously, including visual sensing, chemical sensing, pressure sensing, and sonar sensing. The specific sensing functions attached to a mobile sensor are determined by the material carried by the pipeline and the nature of the inspection. The mobile sensor implements a modular architecture integrating multi-channel RFID read/writers for localization and communication with McRAITs. The main advantage of mobile sensors used in RAMP is their immunity which is not sensitive to the pipeline materials and shapes and are operable during low flow rate conditions.
In the beginning of the inspection, a set of (redundant) mobile sensors are deployed at strategic locations (nearby the upstream station or at intermediate outlets). Once they are deployed in the pipeline P ud , the fluid transported by the pipeline will provide sensor mobility. The mobile sensors examine the pipeline using different sensing functions in their course and report the objects and incidents identified to McRAIT that is close to the incidents. McRAIT helps in determining the mobile sensors’ position by letting its tags serve as markers. After the completion of the inspection, the mobile sensors are collected at the down pumping station of the pipeline. The central controlling system then post-processes the information collected by them for detailed examination.
The third major component of RAMP is the specially designed robot agent, called Fully Autonomous Topology-aware Mobile Pipeline Exploration Robot (FAMPER) as depicted in Fig. 2, for the set \({\mathcal {R}}\). It performs detailed inspection and repair of the reported incidents, after the pre-processing realized by the HPMS inspection. This robot agent is an extended version of the agent that appeared in [20, 21]). It is capable of better mobility in complex topologies, copes with the mass formation inside the pipeline, and overcomes the motion singularity problems caused by direction changes and topology variation. The robot agent is able to stop and even reverse the motion in the pipeline for in-depth inspection of the detected incidents. A robotic arm that is associated with it can be used to install McRAITs and to perform physical actions for repairing of incidents.

FAMPER design. a Front view of the tilted catterpillar. b Side view of the tilted catterpillar
The localization of a HPMS or a FAMPER within a marked pipeline (i.e., a pipeline where McRAIT markers have been uniformly installed) is provided by entities measuring the distance separating them from the closest marker. Figure 3 depicts an application of RAMP.

An application of RAMP
Through these components, RAMP provides the following four major functions:
-
Localization: A scalable set of McRAITs are integrated inside the pipeline in such a way that they are uniformly distributed and the distance separating the McRAIT neighbors can be controlled by the errors acceptable for an effective localization. We provide details on how it is performed later in Section 5.
-
Inspection continuity management: A McRAIT increases significantly the capacity of passive tags needed to store information collected by mobile sensors from pipeline inspection, authorize higher bandwidth for data communications with these tags, improve the event-related information collection and retrieval, and provide data loss-tolerance capabilities of the information collection system in RAMP.
-
Event-related information management: A McRAIT is used as a high-capacity storage device to record history information provided by the active components of RAMP. The availability of this information is needed for the continuity and efficiency of the inspection operation. It can, for example, help detect a mobile sensor that got blocked by a scale formation. In addition, the history information built on a McRAIT can be post-processed by the controlling system after an active component (e.g., mobile sensor) has copied them and delivered them to the controlling center.
-
Repairing: RAMP provides a fully autonomous topology-aware robot agent equipped with different kinds of actuators to repair pipeline damages depending on the inspection and repair demands. It is able to move properly and autonomously to repair the pipeline incidents after they have been identified and located.
3.4 How RAMP meets pipeline monitoring and maintenance requirements?
We now describe in brief how RAMP meets the requirements that are listed in Section 3.1. The discussion here is brief, and the details on specific topics will be found in the later sections.
RAMP meets the customizable requirement since sensing and repairing functions can be added and removed as per the requirement of the system. Moreover, it can work for pipelines with various size diameters, bends, and fluids. Similarly, RAMP meets the dynamic requirement since the knowledge of the location of incidents are not required and they can be dynamic. RAMP meets the autonomous requirement since the sensor and robot agent work independently as well as collaboratively. Moreover, no external control or the power source is needed for them to be able to perform their functions. The remaining requirements are also fulfilled by RAMP as described below:
-
Meeting cost-effectiveness requirement: The cost-effectiveness of RAMP should be deduced from the cost of equipment, cost of deployment, and cost of processing. The cost of the equipment is drastically reduced in RAMP through the use of inexpensive RFID tags. Moreover, the cost in deployment is reduced since the RFID tags only need to be installed in the pipeline only once. Moreover, the cost due to HPMS and FAMPER is also reduced since they are used repetitively for inspections and repair.
-
Meeting scalability requirement: The scalability requirement comes from the topology of the pipelines, the length of the pipelines, the types of incidents, and the number of incident occurrences. RAMP is scalable irrespective of these factors as it does not depend neither on specific pipeline topology nor on pipeline characteristics (shape, size, etc.). Moreover, it can scale with the number and types of incidents since new sensors and repairing tools can be attached to HPMS and FAMPER based on the inspection needs for the system. Moreover, HPMS and FAMPER can be tailored to the length of the pipeline by asking them to work collaboratively to save power so that they can work for considerably long time.
-
Meeting localization efficiency requirement: the localization efficiency comes for the fact that a sensor is able to locate itself anywhere anytime and to locate an incident when detected. Efficiency also depends on the control of the errors made on the computation of the location. As we show later in Section 5, a sensor is able to locate itself anywhere anytime within predefined error threshold and this error threshold applies also on locating an incident when detected.
-
Meeting monitoring proactivity requirement: The monitoring proactivity requirement is that the system should be able to find defects, should be able to predict failures, and should allow rapid repairing. RAMP system is able to find incidents that are occurred in the pipeline and repairing starts as soon as the information collected by the sensors is post-processed by the central controlling system. Moreover, RAMP has the failure prediction capability from the information collected by the sensors over their inspection history. For example, the detection of the change in pressure in one part of the pipeline over time by the sensors implies that a failure might occur in the near future at that part of the pipeline.
4 McRAITs
We proceed by describing a new concept of McRAIT which we design for the very first time in this paper to serve three objectives: First, it increases significantly the storage capacity available at each marker. Second, it allows higher bandwidth for data communication with the passive tags. Third, it improves the fault-tolerance capabilities of the tags available at a given marker by providing redundant storage. This concept adapts some ideas from Redundant Array of Independent Disks (RAID) technology and adds ad hoc management of the data and also from two other ideas provided in [29, 30]; namely, the use of multiple tags and multiple channels concurrently. As multiple tags were used to provide redundancy without increasing the global storage and processing capacity of the systems allowed by the multiple tags, the technique developed in [29] does not show a real benefit of using the multi-tag structure, since it does not allow differential writing operations while maintaining fault-tolerance. Similarly, the technique proposed in [30] allows 8 tags to concurrently send their data to a reader which can increase the data gathering speed and reduce data collision probability. However, the authors did not provide fault-tolerance to the failure of tags and radio channels.
4.1 McRAIT architecture
Figure 4 depicts the architecture of McRAIT which has three major components: (a) the array of tags, allowing to integrate a reasonably large number of tags depending on the availability of frequencies; (b) the low radio range multi-channel transponder for the physical communication with the array of tags; and (c) the McRAIT controller, providing the basic functions to implement the logical mapping.

The McRAIT architecture
The McRAIT architecture provides fault-tolerance using multiple multi-channel RFID tags and adapts to the channel of each tag. It implements multi-channeled RFID readers/writers and a McRAIT controller. This system provides a mechanism to manage concurrently data on multi-tags by segmenting and storing it in a way similar to the storage of data in a RAID system [31]. In addition, it guarantees tolerance to the occurrence of tag and frequency failures. The data that needs to be written on the tags is fragmented by the McRAIT controller, and then the data is sent to the specific tag via the multi-channeled RFID writers corresponding to its related channel. The fragmented data can be retrieved by the multi-channeled RFID readers associated with the channel of each tag and then merged by the McRAIT controller before the data is sent to the sender/receiver. Considering failures addressed by the McRAIT, they can occur when a tag or the channel serving is unavailable to send or receive data. To overcome such failures, each McRAIT is equipped with, like RAID 5 and 6 do, a mechanism that allows tolerance to a maximum of two failures. Indeed, it can be made fault-tolerant to a higher number of failures.
4.2 Functions of the McRAIT controller
A McRAIT controller has two major functions: multiplexing/demultiplexing (MUX/DEMUX) and communication with the markers and the sender/receiver main program. Additional functions can also be embedded in the McRAIT controller. For example, the McRAIT controller can have authentication, data encryption, and special operation commands such as batch deletion. A McRAIT controller should also be able to perform all functions autonomously. Each read and write operation in the RFID tags has to be atomic in the controller so that it can provide, later, multiple physical storages as one logical mapping without requiring preprocessing for the main program. The McRAIT controller is also capable of reporting communication failure(s) to the main program when it reissues the commands over certain number of times.
Multiplexing/Demultiplexing: MUX is a read operation in the McRAIT controller when data arrives from the tags. This operation collects the data from each channel and merges it after data validation using redundant information coming along with the data. After MUX, the resulting data is transmitted to the sender/receiver main program. DEMUX is an atomic write operation performed in the McRAIT controller. It decomposes data based on the rules dedicated for tag storage optimization and redundancy. Then, it builds, for each tag, the related command issued from the original command and the DEMUX operation. The controller also provides an acknowledgment mechanism to check whether an operation has been MUXed or DEMUXed successfully.
Communication: Frequency sharing reduces the potential for mutual interference between tags and increases storage capacity. To provide frequency sharing, McRAIT assigns a single frequency to each tag. The array, as assumed to contain as many tags as the frequencies available, can be addressed by the controller for read and write operations the same way the system described in [30]. When a larger number of frequencies are required, several tags are assigned the same frequency using a frequency division multiplexing (FDM) on the McRAIT to manage the use of a shared frequency between a group of tags.
Several additional operations can also be performed by the McRAIT controller. Among these operations, one can mention the following:
-
Authentication: This function allows to authenticate the identity of the tag and to check the integrity of its content. It can also check whether a write command is authorized. To do so, a unique identifier (UID) and a very light page table (VLPT) are set up for every tag. To achieve authentication, the controller should have a copy of every legitimate UID and should manage and sign the VLPT of each tag it operates on. Mutual authentication may also be needed when some tags are not allowed to deliver their content to an unauthorized sender/receiver.
-
Data encryption: The McRAIT controller can encrypt data and enhance its security with simple fragmentation and encryption operations, and the data encryption can be performed before or even after data fragmentation. Moreover, it can encrypt each fragmented data or selected fragmented data. It is worth noticing that the tags are not involved in any active encryption or decryption task.
-
Special operation commands: The McRAIT controller can invoke special operation commands such as batch commands. Those commands can be sent on each channel for all tags and can be reissued when a failure occurs.
Due to the relatively slow communication speed with tags, several simple tasks, such as batch deletion, which are involved in the aforementioned functions are implemented by McRAIT on the tag side. These tasks help the McRAIT controller in reducing transaction load. Nevertheless, McRAIT can increase the speed of communication, memory capacity, and fault-tolerance by simply adding tags and using more frequencies.
4.3 McRAIT fault-tolerance
RAID and McRAIT present several similarities. First, both architectures use redundant and independent storage and parallel communication. Second, both of the architectures allow to increase capacity, read/write speed, and fault-tolerance. To support the latter feature, McRAIT implements an extra hardware and software controller. However, some differences can be noticed. First, McRAIT architecture is responsible for optimally managing the processing memory and the limited energy which it collects from the incoming communications. In particular, McRAIT implements a VLPT entry, controls its size for supporting all requirements (finding, updating, and deleting requested data to/from tags), and allows delivering the UID and VLPT at the beginning of each transaction executed by the McRAIT controller.
We have selected two implementation strategies for the McRAIT architecture: McRAIT 5 and McRAIT 6. The McRAIT 5 (defined as striped tags with distributed or interleaved parity) strategy combines three or more tags in a way that protects the data against the loss of any single tag. The McRAIT 6 (or striped tags with dual parity) strategy combines four or more tags in a way that protects the data against loss of any pair of tags. The parity information can be implemented using striped set with dual distributed parity. The read/write and data placement strategies (as used in RAID systems) have also been adapted to the McRAIT architecture. In Section 7, in the following, we will analyze the relationship between the number of tags within the McRAIT and the performance of the pipeline monitoring.
5 A technique for incident and sensor localization
5.1 Maximum range estimation
Assuming that a transmitting RFID reader is isotropic − radiates in all directions with the same power density − the power received by an RFID tag at any given distance r from the reader, \(P_{\text {tag}}= P_{\text {reader}} \frac {A_{e,\text {tag}}}{4\pi r^{2}}\), where P reader is the radiated power from the reader antenna and A e,tag is the effective aperture of the tag antenna. Following [32, 33], the effective aperture of an antenna around a half-wavelength long might correspond to a square around a half-wavelength on a side, i.e., \(A_{e,\text {tag}}=\frac {\lambda ^{2}}{4 \pi }\) for an isotropic tag antenna transmitting in a free space, where λ is the related wavelength.
Since we have the effective aperture for an isotropic antenna transmitting in a free space, from a consequence of the principle of reciprocity [33, 34], we can write \(A_{e,\text {tag}}=G_{\text {tag}} \frac {\lambda ^{2}}{4 \pi }\) for a directional antenna, where G tag is the gain measured relatively to an isotropic antenna or to a dipole antenna. Therefore, we can have a very general equation for the power received from a transmitting antenna reader by a receiving antenna tag based on the gains of the reader and the tag, assuming that the distance between them is known.
Equation 1 defines a very convenient way to state the expected received power between a transmitter and a receiver. Another important factor to take into account is the polarization. For the case of linear polarization, Eq. 1 becomes
where θ pol is the angle between the transmitted polarization and the receiving antenna axis. Thus, the maximum forward-link-limited range (denoted as D forward) will be proportional to the cosine of the misalignment angle.
From Eq. 1, defining the minimum power required by a tag to wake up and decode the reader signal as P min,tag, we obtain D forward for a RFID reader as given below with the assumption that there is no misalignment in polarization:
and defining the minimum signal power for demodulation at the reader as P min,reader, we obtain the reverse-link-limited range D reverse as:
where T b (generally =1/3 or −5dB [32]) is the backscatter transmission loss of the tag antenna.
To reach the maximum range provided by Eqs. 3 and 4, we should have
which is equivalent to
Therefore, the P min,reader should be smaller than \(\frac {T_{b}}{P_{\text {reader}}} \times P^{2}_{\text {min,tag}}\) to allow proper communication at the distance equal to D reverse. In the simulation, the latter value is referred to as the maximum distance.
5.2 McRAIT-based localization
We first discuss the scenario to localize a sensor node that goes through the pipeline, detects an incident, and reports it to the closest marker. Figure 5 illustrates this scenario.
-
1.
When the sensor detects an incident (or wants to report on its position), it identifies the type of environment it has to transmit in using an ad hoc sensing function.
Fig. 5 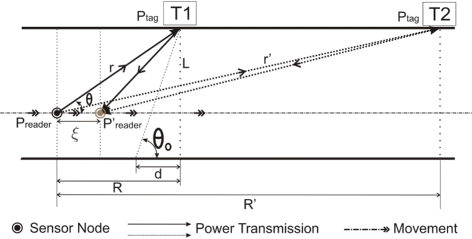
Sensor localization within the pipeline
-
2.
The sensor transmits a signal with a power P reader which reaches the nearest tag T 1 and the next tag T 2, with a power fulfilling the conditions established in the previous subsection.
-
3.
The signal received by the tags is reflected back to the source sensor. It computes the distances r and r ′ to tags T 1 and T 2, using the appropriate formula given in Eq. 3.
-
4.
The sensor selects the nearest tag if the error on the location is smaller than a predefined threshold e T . Otherwise, it selects the second nearest tag. Then, it stores in the selected tag the computed distance as the localizing distance.

The computed distance locates the sensor position (and the incident event, if any) as if it were flowing close to the pipeline wall (this assumption is at the origin of the error addressed at the end of this section and we try to bound this error within the threshold e T by placing markers in certain intervals so that the error on localization for sensors and incidents is within e T ).
In order to perform these steps, we suppose that the distance made by the sensor node during the signal round-trip can be approximated to zero. Consequently, the angle α between r and r ′ is too small and both the transmitted and the reflected signals make nearly the same distance. In the following, we formally establish the expression of this distance.
Let r be the distance separating the sensor node from the nearest tag. According to Eqs. 2 and 4, r can be expressed as follows:
where \(P^{\prime }_{\text {reader}}\) is the received power at the system. The relative error associated to the computation of this distance should fulfill the following inequality:
where \(\frac {\Delta X}{X}\) denotes the relative error associated with a measurable variable X.
Assuming this, it comes that if the system is able to provide P reader, \(P^{\prime }_{\text {reader}}\), and θ pol with less than 3 % error, then the error made on r would be no more than 10 %. Thus, the efficiency of the distance computation may be controlled by the errors made on \(P^{\prime }_{\text {reader}}\) and θ pol.
Supposing that the processing delay at the tag level is minimal with respect to the propagation delay, the distance ξ made by the sensor node during the signal round-trip is given in Eq. 9.
where V m is the sensor velocity and V p is the propagation delay related to the liquid injected in the pipeline. This means that \(\frac {\xi }{r}=\frac {2. V_{m}}{V_{p}}\).
Estimate now the error Δ r on the distance r reported by a sensor to locate itself or an incident it detects with respect to a selected marker. Let R be the actual distance. The error Δ r is given by
Therefore, the relative error \(\frac {\Delta r}{r}\) is smaller than 1−cosθ. Thus, allowing a sensor that is separated from tag T 1 by a distance \(d \geq \frac {L}{\text {tan}{\theta }}\) to communicate with the next tag T 1 would guarantee a relative error smaller than (1−cosθ). In particular, if the threshold e T set for 1−c o s θ to be equal to 10 %, for example (i.e., θ=25°), then the above assumption gives a value for d≥2.1×L, where L is the diameter of the pipeline. For θ 0=15°, the relative error is smaller than 4 % and d≥3.7×L.
Therefore, if the given threshold e T = 4 %, then installing the localization markers (McRAIT tags) in the uniform interval of d=3.7×L always gives the localization error for mobile sensors, robot agents, and incidents within 4 %. Note that the interval distance depends also on the maximum transmission distance of the RFID reader used in HPMS. Since, the RFID reader needs to contact at least two successive RFID tags for the incident storage, if the maximum transmission range of the reader is d tr , then the interval of McRAIT tag installation inside the pipeline is \(\min \left \{\frac {d_{\textit {tr}}}{2},d\right \}\). For the case when \(\frac {d_{\textit {tr}}}{2}\geq d\), the localization error within e T is immediate as discussed above. For the case when \(\frac {d_{\textit {tr}}}{2}< d\), the interval is smaller than d and it is easy to see that the localization error is again within e T .
We will study in Section 7 the variation of the error experienced by measuring of the distance between a sensor and a selected tag to which the distance is computed.
6 RAMP design
6.1 McRAIT design
A RFID tag can hold a unique identifier (UID) that can be used for inventory management at the global scale. More than just holding an UID, a tag can carry re-writable persistent storage accessible via a reader. In this sense, RFID tags can extend a sensor network by providing sensing properties to otherwise unsensible objects; thus, they provide the last-hop connection of a sensor network.
In RAMP, the passive RFID tags work as fixed sensors. They are integrated under a McRAIT structure inside the pipeline at a reasonable distance computed in the previous section between each other, while RFID reader/writers are integrated in the mobile sensors and the robot agents. Sensors and the robot agent can read and write the McRAIT tags that are available in their course of operation for recording the events. They can also collect the history of events stored on McRAITs and clean their contents.
RAMP uses arrays of eight tags (of the order of 2048 bytes) providing a storage capacity of 12 KB (=6×2 KB) for storing event information and 4 KB for fault-tolerance. The content of every tag is divided into three types of areas to allow the storage of data structures. The first area is located at the front of the tag and contains only the data related to the identification of the tag and the table reporting on the page content (VLPT). In particular, 8 bytes is used for tag identification, which allows the management of 4 billion tags, if only half of them is used and the other half is reserved. VLPT contains 4 rows of 16 bits each. The bit located at the ith row and the jth column shows whether the jth 32-bit word in the ith block is empty (bit equal to 0) or full (bit equal to 1). The second area includes the information related to the history of sensor mobility. Every data structure related to history is assumed to start with a 0 bit and can be appropriately structured. The third area contains the information related to the events detected by the sensors. Every data structure related to events starts with a 1 bit.
Every data structure reporting on history or incident events is a 32-bit word. History data structure contains information about the sensor ID associated with the history event and the timestamp of the storage operation. Incident event data structure contains information about the timestamp of the storage, event location, event type, and some extra information related to the event. The structure used for the event location field contains a pair (r,n), where r is the effective distance to the closest tag to the event occurrence and n is the number of tags separating this tag to the tag storing the incident event data structure. Therefore, the distance separating the incident position and the marker containing the related event is bounded by 2s, where s is the number of bits used to store n.
Memory management in the RFID tags is handled based on the following different situations:
-
Managing memory full condition: Once the memory of the McRAIT located at a marker near a mobile sensor becomes full, the data gathered by the sensor is stored in the next McRAIT tag with available entries. When a tag is unavailable within 2s−1 marker, the sensor selects a McRAIT from the following 2s−1 markers at random. It deletes the oldest entry and stores the reported event.
-
Initializing the monitoring: Once the pipeline inspection process starts, the first mobile sensor in the batch deletes all the entries and history by putting the 0 bit to the VLPT, and storing its identity in the history area. The deletion operation is subject to a criterion; when the information related to a preceding inspection is required, the deletion is performed by conditions on the timestamp field.
-
Entry duplication: Due to the space limitation of McRAITs, redundancy is optimized. Event storage is subject to the absence of a report on the event made by another mobile sensor prior to it. For this technique to work, the sensors need to be synchronized. Synchronization can be performed at the pipeline’s entrance.
-
Tracking mobile sensors: Mobile sensors are tracked through a registration scheme in which every sensor, at a designated marker, registers its identity along with a timestamp. To efficiently use available storage, a criterion can be used. In particular, the registration scheme can be applied to selected markers based on a density-aware selection criterion, for example, the registration can be made every 5 McRAITs.
6.2 HPMS design
RAMP requires high-performance processing power for the mobile sensors in order to achieve accurate inspection and execution of the complex functions. Since the mobile sensor’s mission within the pipeline does not last for a long time, the power limitation does not affect such achievement. Notice that power limitation is a serious handicap for sensor-based applications such as those using MICA [35].
An HPMS is designed with four components: a main board, a McRAIT controller, a sensing platform (containing different sensors), and a container. It has a flexible interface to integrate other sensors and communication capabilities. It also needs to be sufficiently small in size and light to facilitate its transportation by the liquid inside the pipeline. The main process in the HPMS manages complex tasks and controls the sensors and the McRAIT controller. It consists of two components: an Overo-board [36] and an interface board (Fig. 6). The Overo-board is made by Gumstix Inc. It has 600MHz OMAP 3530 Applications Processor with ARM Cortex-A8 CPU, 256-MB main memory, and 256-MB flash memory. It provides both Wi-Fi and Bluetooth communication capabilities. Moreover, it is equipped with the C64x+ digital signal processor, which accelerates processing of signals coming from sensors. All these functions are completely implemented in a very tiny board of size 17 × 58 × 4.2 mm.

HPMS interface board
The interface board is designed to integrate various sensors such as a CCD camera, sonar sensors, pressure sensors, and chemical sensors. Regarding chemical sensors, HPMS currently uses a methane gas sensor and a CO (carbon monoxide) gas sensor, which are the most basic sensors for detecting the mixture of toxic and non-toxic gases produced and collected in the sewer pipeline; note that many other sensors can also be added in HPMS depending on the inspection need. Regarding camera sensors, HPMS includes a camera sensor module OV5640 (http://www.ovt.com/products/sensor.php?id=177) that takes pictures of the incidents and stores them in the HPMS storage dedicated to save those pictures. This storage helps in capturing the incident details without overloading the limited storage and communication capability provided by McRAIT tags. Moreover, considering the storage requirement in case of many incidents, the camera sensor becomes active only after an event is triggered by other sensors to take picture for detailed inspection. Sensors are pre-coded on when they trigger the camera sensor. Regarding sonar sensors, HPMS uses the lower power untrasonic sensor Maxbotix LV-MaxSona family series (http://www.maxbotix.com/documents/LV-MaxSonar-EZ_Datasheet.pdf) which provides the distance measurement on detected objects only consuming 2mA. Regarding pressure sensors, HPMS uses the barometric pressure sensor BMP180 (http://www.bosch-sensortec.com/en/homepage/products_3/environmental_sensors_1/bmp180_1/bmp180) which can measure the change in the pressure inside the pipeline even under the open channel.
The interface board is fully connected to the Overo-board through two 70-pin AVX 5602 series connectors. Moreover, the interface board provides 4 generic USB ports and regulates stable electric power from batteries to supply all devices in the HPMS. Extra sensors can be added to the HPMS through USB ports, or through extension boards stacked on top of the interface board. The McRAIT controller integrates the SkyeModule M10 UHF module [37] and a redundant array of independent tags (RAIT) software. The SkyeModule M10 reader module has up to 5 m of communication range in maximum scan mode (1.5 mA, 30 db). Since the mobile sensors (and the RFID readers) are operated for a very short time (only in the inspection time), the power should not be the issue for the reader (and also for HPMS). However, if the reader (and HPMS) needs to operate for a relatively long time, it can perform power control and noise reduction through a power management policy of HPMS which allows the reader to be in idle and active scan mode. The idle mode duration for the reader can be adjusted by the travel velocity of HPMS during pipeline inspection so that power can be managed optimally. This adjustment is possible since HPMS can estimate travel distance/time between the detected tag and the next tag in its way based on the travel speed calculated by the values provided by an accelerometer sensor. The SkyeModule M10 reader also provides a library, called SkyeAPI, that simplifies and automates the RFID tag and protocol-specific functions. Lastly, two types of containers are used within the HPMS to protect the whole device from external hazards and provide floating capabilities. The two types are the capsule container and the spherical container. The overall dimension of a container does not exceed 80 mm, making the HPMS usable in small size pipelines. However, it can have a larger size for more intensive functions, when used in larger sized pipelines.
6.3 FAMPER design
The autonomous robot agent designed for RAMP is compact, efficient, and smart. It is a self-contained robot that can navigate and analyze pipeline incidents using on-board resources. The robot agent has four tilted caterpillars set up uniformly all around the robot body. The tilted caterpillars provide a spiral motion of the robot inside the pipeline (5° tilted caterpillars have been prototyped as depicted in Fig. 2). We have found that the spiral motion performs better than the straightforward motion in the presence of motion singularity problems [14]. In particular, the tilted caterpillars provide the functionality to self-adjust the position so that three or more caterpillars eventually get in contact with the surface of the pipeline wall when motion singularity conditions occur.
Each caterpillar frame has four shrinkable shafts that provide support and 50 % shrinkability, giving the robot the flexibility to use in inspecting pipelines of variable sizes. In particular, the robot agent allows a maximum shrinkability of about 20 mm, as shown in Fig. 7, where the outside circle represents the pipeline wall and the dotted circle shows the robot size at the full shrinking condition.

Cross-sectional view of FAMPER
The design based on tilted caterpillars allows the robot to travel vertically as well as horizontally in pipelines with different fittings. Furthermore, we address electrical and reactivity challenges through a robust structure design. The electrical part of the robot is made waterproof; meanwhile sufficient space and resources are added to allow the robot to handle chemical and mechanical actions. The robot is equipped with a chemical sprayer for chemical actions and a robotic arm to handle physical accidents.
6.4 RAMP prototype
The RAMP prototype that we developed provides a thorough analysis of all functions and features. Currently, the prototype integrates (a) a storage device that has the capability to store information about health-related events and sensor location capable of reducing the marker’s failure, (b) a robot agent that is capable of spiral and vertical motion in 150-mm-diameter pipelines, and (c) a reader and writer system that is capable of supporting incident location. Ongoing activities include the implementation of (a) a configurable McRAIT that copes up with large applications and provides fault-tolerance to tag and channel failures, (b) a prototype for HPMS including various sensor functions and efficient power management including sleep-mode strategies that allow the coordination of HPMS activities, in order to cope with long pipelines, and (c) different robot agents adapted for different pipeline usages and sizes.
In particular, several strategies to increase the HPMS inspection range can be achieved by adjusting the quality of inspection such as wakeup sensing (sonar, camera, etc.) by a triggering sensor (sound, barometer, accelerometer, etc.), controlling communication with McRAIT-based markers, and using multi-HPMS coordination. Nonetheless, we have found that, in the case of sewer pipeline with a fluid speed of about 0.5 km/h (which is slower than the minimum recommended velocity for sewer flow, http://www.edmonton.ca/city_government/utilities/sewer-design-standards-guidelines.aspx), the maximum inspection range of HPMS that can be easily achieved is 4 km, which is 8 h with the wakeup trigger sensing mode and the activate/deactivate tag scan mode. Therefore, an accurate coordination between 25 HPMSs allows an inspection range higher than 100 km.
Moreover, HPMSs can be configured with different strategies to increase their life cycles. Two kinds of strategies can be applied to this end, the collaboration-in-group strategy and the individual-target-range strategy. In the former strategy, a bunch of HPMSs act as a collaborating group and allow only one HPMS in the group to be active at a time. An efficient communication scheme coordinates the sleep/awake process of the members of the group. In the latter strategy, HPMSs are configured with different target range settings on which they switch to active mode while they will be in sleep mode the rest of the time.
The prototype for the robot agent FAMPER (depicted in Fig. 2) has 4 expandable one-segment tilted caterpillars. The robot has attached an RFID reader/writer to collect information stored at the tag level, a chemical tank and sprayer for actuation purposes, two Li-ion batteries for 1-h life, and a CCD camera for creating high-quality images related to inspection. It has high processing power, large memory, and several sensing functions. In addition, the robot has four extendable external interfaces to add different modules for pipeline inspection demands as shown in Fig. 7.
To cope with the pipeline size, the topology of the pipeline is assumed to provide several points of access/exit to the pipeline. The distance between two consecutive points is clearly linked to the life cycle of the robot. This distance can vary from several kilometers to several tens of kilometers based on power resources available for the robot agent, the nature of inspection/repairing, and the complexity of the pipeline topology (e.g., number of bends).
Finally, notice that several requirements need to be satisfied so that the HPMSs and robot agents can inspect the pipeline system properly. For the localization to be efficient, the distance between the markers should be smaller than the radio communication range of the RFID and the propagation model should fit with the nature of the liquid/gas inside the pipeline. The pipeline should be filled at a certain level such that HPMSs can flow and communicate with the McRAIT markers using radio frequencies.
7 Experiments
To validate the performance of RAMP, several simulation experiments have been conducted. The objective of the simulation was, first, to analyze the marker occupancy size over time and inspections; second, to estimate the maximum range and relative errors in the McRAIT-based localization; and third, to compare the efficiency of RAMP with respect to a system that does not use mobile sensors and builds on a different localization scheme.
The illustration of the pipeline system used in the simulation experiments is given in Fig. 8 which comprises linear segments and horizontal and vertical L-bends to demonstrate the capability of the robot agent FAMPER to cope up with the complex environments. In particular, the pipeline system (Fig. 8) consists of 26 pipeline segments, one upstream station, and one down pumping station. The pipeline used in the pipeline system is a 150-mm sewer pipeline to which a McRAIT-based marker is attached every 500 mm. We assume that the fluid carried by the pipeline is flowing in the direction as indicated by the arrows. We also assume that each marker has limited storage capacity (only 2KB × the number of tags in the related McRAIT) to store history and incident information during the pipeline inspection. The mobile sensors are drifted to the pipeline from the upstream station and transported by the fluid through the pipeline. The drifted mobile sensors are collected at the exit of the pipeline and their storage is uploaded to the central controlling unit from the down pumping station for further processing of incident localization and pipeline health-related information collection. The incidents within the pipeline are artificially created at random locations to simulate the actual pipeline environment evolution.

Illustration of a pipeline system used in experiments
In the experiments related to the marker occupancy, we first derive the optimal values of the number of markers that should be installed per segment in the pipeline (denoted by s/s), the number of tags per marker (denoted by m), the number of inspection history information that can be accommodated (denoted by H), the number of mobile sensors (denoted by n) used in a mission, and the number of hops (denoted by Hop) that are used to store the incident information when they are detected. The number of hops is measured in terms of the number of successive markers found between the incident location and the actual marker where the incident information is stored.
In order to estimate the optimal values of s/s, m, H, n, and Hop values, we develop an algorithm that allows the mobile sensors drifting inside the pipeline and arriving to a junction to randomly select one of the available directions and write randomly on two among the markers available on that segment to store their identity. If an incident is detected during inspection and the memory entries of the markers in the vicinity of the detecting mobile sensor are full, then the data is stored in the next available marker, provided that the distance to that marker can be reported in the event location field (in our experiments it is equal to 6) of the RFID event structure. Indeed, the algorithm assumes that the detecting mobile sensor tries to write in the first available marker until Hop/2. If no marker is available within this range, a next marker is randomly selected among the next Hop/2 markers and the information is written on it, by overwriting the oldest entry, if needed.
Figure 9 shows the average occupancy of the McRAITs installed in each marker in the pipeline. It shows that the load of the McRAITs increases with the number of histories (H) related to inspection missions and the number of mobile sensors (n) used for inspection. In addition, we notice that for a fixed number of mobile sensors, the McRAIT load increases significantly with H and decreases with the number of markers/segment (s/s). This shows the tradeoff between the load and the product H×(s/s). Moreover, Fig. 10 shows the average occupancy of messages in McRAITs with different values of H. In sum, these two figures demonstrate that the storage space of a marker (or the number of tags per marker) is determinant for the history the system needs to keep in memory. In particular, only 4 tags are needed to provide an occupancy under 60 %, when there is no need to memorize more than 20 inspection missions.

Average occupancy of the marker storage for different parameter settings and H o p=6

Average occupancy of the marker storage for different history settings, and n=100,s/s=20, and H o p=6
We also evaluated the RFID entry concentration (or load) on the markers installed in the pipeline. Figure 11 shows the 3D graph depicting the load of all the 4-tag McRAITs installed on the markers when 12 incidents are randomly generated and 50 mobile sensors are used, assuming that H=5, s/s=10, and Hop = 6. The figure demonstrates that the markers located just after the incidents have higher load and that the following markers have decreasing loads with the distance separating them from the incident.

Measured RFID entries concentration for 12 incidents using 4-tag McRAITs with values of n=50,H=5,s/s=10, and H o p=6
The second set of experiments aimed at estimating the maximum range and relative errors in the McRAIT-based localization. Figure 12 shows the maximum forward-link-limited range (D forward) estimation between a RFID reader and a marker for an ideal isotropic antenna, a dipole antenna with gain 2.2 dBi, and a directional antenna with gain 6 dBi for the various transmitted powers of the RFID reader. The figure demonstrates that for the system to be effective using the state-of-the-art tags, the distance between two consecutive markers should be smaller than 14 m. This distance can be improved by increasing the transmitting power of the RFID reader and the tag capacity to react.

Maximum limited radio range between a reader and a marker for different transmitted power
Figure 13 shows the variation of maximum relative error \(\frac {\Delta r}{r}\) on the reported distance with the variation of threshold angle θ 0. It shows that when θ 0 is smaller than 25°, the error is smaller than 10 %.

Maximum relative error vs. threshold angle plot
It is even smaller than 4 % when θ 0 is lower than 15°. The relation between the diameter of the pipeline L and the distance d from which it has to contact the next closest tag for different threshold angles is given in Fig. 14.

The relation between distance d and diameter L of the pipeline
One can notice that for θ 0=15°, the distance should be around 3.7×L. Figure 15 depicts the relation between the average error (Δ r) made on the reported distance and the number of incidents in the pipeline, assuming the distance between two markers in the pipeline is 1000 mm, pipeline diameter is L = 150 mm, and mobile sensors are drifting at 50 mm above from the bottom of the pipeline. The figure shows that when the number of incidents grows from 0 to 100 the average is increasing. This average remains constant for numbers of incidents higher than 100, despite the value of θ 0. In other words, the figure demonstrates that the number of incidents has no effect on the average value of the error made on the localization distance to a marker.

Effects of the number of incidents on the average error made on the reported distance
The third set of experiments aimed at comparing three strategies that can be implemented by the robot agent FAMPER to find a reported incident. The strategies are as follows: (a) the robot is aware of the incident position (as provided by our system); (b) the robot applies the depth-first strategy to locate the incident; and (c) the robot attempts a random walk. The major parameter used in the comparison is the number of segments traveled from the upstream station made by the robot to find the reported incidents. To achieve a significant comparison, the random walk strategy is repeated several times (1,000,000 random samplings) and the distance computed is the average number of segments traveled. The distance reported for the depth-first-based strategy is also the average of the distances needed to reach all incidents located at the same segment count with respect to the upstream station. Figure 16 depicts the comparison of the number of segments needed to travel by the robot agent for a grid pipeline having 10 per 10 segments. We can notice that our approach gives the least distance to perform (since the graph is the bisector of the first quadrant). The other two methods compute an average distance that is very high compared to our method.

Comparison of the average distance the robot agent travels to find reported incidents using three strategies
8 Conclusions
We presented RAMP, a novel autonomous monitoring and pipeline maintenance system which combines sensor- and robot agent-based technologies with RFID technology for the very first time to bring forth a cost-effective, scalable, and customizable system that can efficiently locate health-related events. This leads to more accurate and effective maintenance of a large range of pipeline systems compared to the techniques proposed in the literature.
The proposed system has many rooms for future improvements. We need to develop unfinished features of the robot agent for real-world implementations such as the liquid resistance of a robot agent, secure mobility in pipelines of different sizes and materials, and goods transported by pipelines. In addition, it needs more sensitive and powerful sensors for detailed inspection and energy-efficient components and powerful battery for increasing mission range of the robot agent. Further, we need to develop various types of buoys for mobile sensors which provide not only protection of the components of the mobile sensor but also increase efficiency of inspection during its operation. Lastly, we should implement the McRAIT architecture to improve the performance of the fixed sensor and the efficiency of event location of RAMP.
Nevertheless, RAMP has demonstrated the feasibility and superior performance in comparison to existing pipeline monitoring systems and also showed its cost-effectiveness and scalability. Our contributions include an efficient technique for localization, fault-tolerant system for information storage and localization support, and the design of an autonomous 4-caterpillar robot. Experiments along with the prototyping activities demonstrate the feasibility and superior performance of RAMP in comparison to existing pipeline monitoring systems, along with its cost-effectiveness and scalability. The preliminary results of this work has been presented in conference papers.
References
N Mohamed, I Jawhar, in The Second International Conference on Sensor Technologies and Applications (SENSORCOMM). A fault tolerant wired/wireless sensor network architecture for monitoring pipeline infrastructures (IEEE, 2008), pp. 179–184.
N Mohamed, I Jawhar, K Shuaib, in The International Conference on Wireless Networks (ICWN). Reliability challenges and enhancement approaches for pipeline sensor and actor networks (World Academy of Science, Engineering and Technology, 2008), pp. 46–51.
F Murphy, D Laffey, B O’Flynn, J Buckley, J Barton, in The 4th European Conference on Wireless Sensor Networks (EWSN). Development of a wireless sensor network for collaborative agents to treat scale formation in oil pipes (ACM, 2007), pp. 179–194.
Y Jin, A Eydgahi, in The IJAC-IJME International Conference. Monitoring of distributed pipeline systems by wireless sensor networks (International Journal of Modern Engineering (IJME), 2008).
J Kim, JS Lim, J Friedman, U Lee, L Vieira, D Rosso, M Gerla, MB Srivastava, in The 6th Annual IEEE Communications Society Conference on Sensor, Mesh and Ad Hoc Communications and Networks (SECON). Sewersnort: a drifting sensor for in-situ sewer gas monitoring (IEEE, 2009), pp. 691–699.
I Stoianov, L Nachman, S Madden, T Tokmouline, in The 6th International Conference on Information Processing in Sensor Networks (IPSN). PIPENET: a wireless sensor network for pipeline monitoring (ACM, 2007), pp. 264–273.
H Schempf, in Natural Gas Technologies III Conference. Gasnet: Sensing and communications network system for low- and high-pressure distribution gas mains, (2005).
S Hirose, H Ohno, T Mitsui, K Suyama, in The International Conference on Robotics and Applications (ICRA), 3. Design of in-pipe inspection vehicles for ϕ25, ϕ50, ϕ150 pipes (IEEE, 1999), pp. 2309–2314.
J Tao, Q Peiwen, T Zhengsu, in The International Symposium on Micro-Nanomechatronics and Human Science (MHS). Development of magnetic flux leakage pipe inspection robot using hall sensors (IEEE, 2004), pp. 325–329.
M Muramatsu, N Namiki, R Koyama, Y Suga, in The International Conference on Intelligent Robots and Systems (IROS), 3. Autonomous mobile robot in pipe for piping operations (IEEE, 2000), pp. 2166–2171.
S-G Roh, HR Choi, Differential-drive in-pipe robot for moving inside urban gas pipelines. IEEE Trans. Robot. 21(1), 1–17 (2005).
C Jun, Z Deng, S Jiang, in The IEEE International Conference on Robotics and Biomimetics (ROBIO). Study of locomotion control characteristics for six wheels driven in-pipe robot (IEEE, 2004), pp. 119–124.
M Horodinca, I Doroftei, E Mignon, A Preumont, in The International Colloquium on Mobile and Autonomous Systems (ICAS). A simple architecture for in-pipe inspection robots, (2002).
YS Kwon, H Lim, E-J Jung, B-J Yi, in The International Conference on Robotics and Applications (ICRA). Design and motion planning of a two-moduled indoor pipeline inspection robot (IEEE, 2008), pp. 3998–4004.
AAF Nassiraei, Y Kawamura, A Ahrary, Y Mikuriya, K Ishii, in The International Conference on Robotics and Applications (ICRA). Concept and design of a fully autonomous sewer pipe inspection mobile robot “KANTARO” (IEEE, 2007), pp. 136–143.
JY Choi, H Lim, B-J Yi, in SICE-ICASE, 2006. International Joint Conference. Semi-automatic pipeline inspection robot systems, (2006), pp. 2266–2269.
E Rome, J Hertzberg, F Kirchner, U Licht, T Christaller, Towards autonomous sewer robots: the makro project. Urban Water. 1(1), 57–70 (1999).
Y-C Chang, T-T Lai, H-H Chu, P Huang, in The International Conference on Mobile Data Management (MDM). Pipeprobe: Mapping spatial layout of indoor water pipelines (IEEE, 2009), pp. 391–392.
H Schempf, E Mutschler, A Gavaert, G Skoptsov, W Crowley, Visual and nondestructive evaluation inspection of live gas mains using the explorer TM family of pipe robots. J. Field Robot. 27(3), 217–249 (2010).
J-H Kim, Design of a fully autonomous mobile pipeline exploration robot (FAMPER). Master’s thesis (2008). Department of Computer Science, Louisiana State University, http://etd.lsu.edu/docs/available/etd-11112008-121037/.
J-H Kim, G Sharma, SS Iyengar, in The International Conference on Industrial Technology (ICIT). FAMPER: A fully autonomous mobile robot for pipeline exploration (IEEE, 2010), pp. 517–523.
J-H Kim, G Sharma, S S. Iyengar, in The 36 th Annual Conference on Industrial Electronics Society (IECON). Design concept and motion planning of a single-moduled autonomous pipeline exploration robot (IEEE, 2010), pp. 1500–1505.
I Jawhar, N Mohamed, K Shuaib, in Wireless Telecommunications Symposium (WTS). A framework for pipeline infrastructure monitoring using wireless sensor networks, (2007), pp. 1–7.
M Meribout, A wireless sensor network-based infrastructure for real-time and online pipeline inspection. IEEE Sensors J. 11(11), 2966–2972 (2011).
Z Sun, P Wang, MC Vuran, MA Al-Rodhaan, AM Al-Dhelaan, IF Akyildiz, Mise-pipe: Magnetic induction-based wireless sensor networks for underground pipeline monitoring. Ad Hoc Netw. 9(3), 218–227 (2011).
Pure Tech Ltd, SmartBall for water and wastewater water mains (2005). http://www.puretechltd.com/platforms/smartball/.
H Schempf, E Mutschler, V Goltsberg, W Crowley, Grislee: Gasmain repair and inspection system for live entry environments. Int. J. Robot. Res. 22(1), 603–616 (2003).
H Schempf, E Mutschler, V Goltsberg, G Skoptsov, A Gavaert, G Vradis, in The Workshop on Advances in Service Robotics (ASER). Explorer: Untethered real-time gas main assessment robot system (IEEE, 2003).
L Bolotnyy, G Robins, Multi-tag RFID systems. Int. J. Internet Protoc. Technol.2(3–4), 218–231 (2007).
Y Nakagawa, M Muraguchi, H Kawamura, K Ohashi, K Sakaguchi, K Araki, in The Vehicular Technology Conference (VTC). Novel multi-stage transmultiplexing digital down converter for implementation of rfid (iso18000-3 mode 2) reader/writer (IEEE, 2007), pp. 2300–2304.
DA Patterson, G Gibson, RH Katz, in The International Conference on Management of Data (SIGMOD). A case for redundant arrays of inexpensive disks (RAID) (ACM, 1988), pp. 109–116.
DM Dobkin, The RF in RFID: Passive UHF RFID in Practice (Newnes, Newton, MA, USA, 2007).
CA Balanis, Antenna Theory: Analysis and Design (Wiley-Interscience, 2005).
MS Neiman, The principle of reciprocity in antenna theory. Proc. Inst. Radio Eng. 31(12), 666–671 (1943).
Crossbow Technologies, Product Reference Guide. http://www.investigacion.frc.utn.edu.ar/sensores/Equipamiento/Wireless/Crossbow_Wireless_2007_Catalog.pdf. Accessed 18 Dec 2015.
Gumstix Inc, Overo Fire COM. http://media.gumstix.com/docs/gs3703f.pdf. Accessed 18 Dec 2015.
Skyetek, Skye Module M10. http://www.skyetek.com/docs/m10/m10brochure.pdf. Accessed 01 Aug 2015.
Author information
Authors and Affiliations
Corresponding author
Additional information
Competing interests
The authors declare that they have no competing interests.
Rights and permissions
Open Access This article is distributed under the terms of the Creative Commons Attribution 4.0 International License(http://creativecommons.org/licenses/by/4.0/), which permits unrestricted use, distribution, and reproduction in any medium, provided you give appropriate credit to the original author(s) and the source, provide a link to the Creative Commons license, and indicate if changes were made.
About this article

Cite this article
Kim, JH., Sharma, G., Boudriga, N. et al. Autonomous pipeline monitoring and maintenance system: a RFID-based approach. J Wireless Com Network 2015, 262 (2015). https://doi.org/10.1186/s13638-015-0495-y
Received:
Accepted:
Published:
DOI: https://doi.org/10.1186/s13638-015-0495-y