- Research
- Open access
- Published:
An energy-efficient communication system using joint beamforming in multi-hop health monitoring sensor networks
EURASIP Journal on Wireless Communications and Networking volume 2017, Article number: 172 (2017)
Abstract
This paper presents an energy-efficient wireless ad hoc communication system and baseband transceiver for sensor networks that gather vital sign information of patients. The design of the proposed system is aimed to facilitate an energy-efficient and low-latency vital sign data transmission service. Based on this aim, the proposed system adopts multi-hop transmission and joint transmitter-receiver beamforming technique to efficiently transmit data at significantly reduced transmission power. Furthermore, to shorten the transmission latency and reduce channel contention, we proposed a novel Medium Access Control (MAC) mechanism which includes neighborhood discovery, packet collision detection and prioritized transmission scheme based on an Orthogonal Frequency Division Multiple Access (OFDMA) physical layer. Simulation of transmission power, transmission latency, and data rate, together with proposed hardware architecture, were all carried out to verify the effectiveness and feasibility of the proposed system.
1 Introduction
Wearable devices monitoring personal health are assuming more prominence recently. With this comes the challenge of developing smaller, more energy-efficient communication transceivers embedded in these wearable devices. Consider a group of these wearable devices that form a small sensor network eco-system, which is responsible to collect information for health monitoring at hospitals or care facilities. Vital signs, such as body temperature, heart rate, blood pressure, respiratory rate, and ECG, are all indicative of the health condition of a patient. By monitoring these vital signs, doctors and nurses can not only keep track of patient’s condition but also react promptly in case of emergency. Unfortunately, current vital sign monitoring solutions in hospitals generally sacrifice the patients’ freedom of mobility. The cumbersome measurement equipment and the cables inevitably confine the patients to bedside. In contrast, wearable/portable measurement devices with wireless connectivity enable patients to walk around freely, facilitating patient mobility and ambulation.
Taking into consideration the battery life and the requirement of continuous monitoring, the proposed wireless communication system provides an energy-efficient and low-latency data transmission service to cooperate with the portable vital sign measurement equipment. In order to realize this system, we propose a mesh-based ad hoc wireless communication system where user nodes can transmit their data with reduced power via multi-hop transmission. Also the proposed wireless system adopts joint transmitter-receiver beamforming technique to further enhance its energy efficiency and reduce interference footprint. Also to reduce inter-carrier and multiuser interference and to provide multiple user channel access, OFDMA (Orthogonal Frequency Division Multiple Access) technique, together with a state-of-the-art PHY layer design, is employed in the proposed wireless solution.
To tackle a more challenging latency-sensitive scenario, we picked ECG monitoring as the target information gathering application. Compared to other vital signs, ECG waveforms require relatively high data rate. The quality of a single ECG lead recorded at 300 Hz was shown to be adequate for diagnosis [1]. Given 16 bits per sample, we need a data rate of approximately 60 Kbps to transmit a 12-lead ECG waveform. This low but steady data rate characteristic favors the OFDMA technique, which allows multiple transmission links to communicate simultaneously and thus keeps the latency to a minimum. In addition, to further reduce the transmission latency, we have proposed a distributed control channel access mechanism where user nodes are classified into four access classes according to the amount of vital sign data yet to be transmitted (higher classes have higher transmission priority). In this way, user nodes carrying more backlog data would have higher transmission priority to form transmission links with target receivers. Furthermore, in our proposed MAC mechanism, the nodes can gather neighborhood information during a neighborhood discovery phase. Another unique mechanism in this MAC allows nodes to detect packet collision for tackling network congestion and deadlocks.
In [2], a comprehensive survey of wearable health monitoring devices was provided. Among other things, the survey discussed wireless link reliability, power efficiency, and clinical effectiveness. Related advances in sensors for health monitoring were described in [3]. A study on power consumption in ZigBee, Bluetooth low energy, and 802.15.6 can be found in [4]. Our proposed MAC has similarities to ZigBee, the crucial improvement being that we adopted contention in OFDMA segments for better efficiency. The guaranteed transmission opportunity in our system is provided via OFDMA subcarrier allocation as compared to traditional time-domain scheduling. Also in our proposed system, neighborhood discovery allows us to achieve a continuous update on next hop candidates. Along with this, an important difference is that when a sensor node has no data to deliver (cf. Inactive state in ZigBee), it will be left out of the neighborhood discovery mechanism, thus saving energy. Moreover, we used joint beamforming technique to achieve higher energy efficiency. An important result on multi-hop sensor network performance analysis in [5] showed that throughput of the system increases if the effective sensing SNR is close to the desired SNR for reliable reception. Using effective transmission power tuning by dynamically switching between different MCS schemes, we achieved the required robustness in multi-hop transmission systems.
In [6], the authors discussed a method to predict congestion and accordingly find a routing path to reduce the effect of congestion. On the other hand, [7] proposed a game theoretic approach to power control aiming at minimizing congestion. In contrast to [6], where the transmit power level and multi-hop neighbors need be known, in our proposed system, these parameters will be decided dynamically in each frame. Also, [7] aimed at reducing transmit power but did not include the node reachability and isolation probability criteria when the transmit power is determined. Thus, to alleviate congestion and deadlock in ad hoc WSN with transmit power tuning, we designed a MAC layer mechanism with continuous neighborhood discovery update and OFDMA-based resource allocation. The nodes can choose between four access classes to increase the reachability and avoid congested resource. In the proposed system, carrier sensing and back-off (CSMA/CA) is the fallback mechanism in case the number of nodes exceeds the available OFDMA resource.
With regards to baseband transceiver design, a low-power design approach for WBAN based on FSK transceiver was described in [8]. In [9], a SoC solution based on ECG acquisition and ZigBee transmitter was presented. In contrast to [9], we developed a baseband design with an embedded medium access controller. This provided us unique cross layer support for MAC algorithm tuning. For example, our design can detect packet collision in the PHY layer based on preamble and then feed the information to the MAC layer. Numerous OFDM transceiver designs have been reported in literature; we note [10], [11], and [12] for their focus on short-range communication or OFDMA baseband design. As compared to [11], we have proposed significantly more flexible and advanced design for the OFDM receiver. In our design, MCS and beamforming vectors and transmit power control are adjusted dynamically. Furthermore, an improved timing synchronization and carrier frequency recovery based on channel weighting was developed.
The rest of the paper is organized in sections to present the proposed system in detail. Section 2 introduces the network topology, physical layer parameters, and the frame structure of the proposed wireless communication system. The preamble design for OFDM symbol detection, carrier frequency offset (CFO) estimation, and collision detection is also illustrated in Section 2. The proposed MAC layer design using OFDMA and neighborhood discovery mechanism are illustrated in Section 3. In Section 4, we briefly introduce the energy-efficient data transmission mechanism using joint beamforming with signal to interference and noise ratios (SINR) constraint. Furthermore, the baseband transceiver architecture is introduced in Section 5. In Section 6, the channel and antenna model used in the simulation are introduced. The numerical simulation results are also presented to validate the effectiveness and energy efficiency of the proposed system. Finally, Section 7 concludes this paper.
2 Physical layer design
2.1 Network topology
Figure 1 shows the network topology of a multi-hop sensor network. In the network, there exist several access points (APs) which connect to the health care center via cable or wireless LAN. Apart from the 12-lead ECG, which can itself be a wireless node, we can have other wireless nodes placed strategically in proximity of a patient, e.g., in the hospital room or the patient’s house/office. This way, we have a network of closely spaced wireless nodes connected to the sensor nodes on one side and eventual data processing center on the other side. User nodes in the network can communicate with each other and the data from each sensor node is transmitted to the APs via multi-hop transmission which breaks the long-distance transmission into a series of short-distance hops between two neighboring user nodes, effectively reducing the total transmission power needed. Moreover, the nodes will use joint beamforming to improve SINR while saving transmission power.

Network topology of the proposed system
2.2 Physical layer parameters
Table 1 lists the physical layer parameters of the proposed wireless system. The sampling clock frequency is 6.857 MHz and the OFDM FFT size is 128. The total 128 subcarriers include 19 guard subcarriers, one DC subcarrier, and only 108 subcarriers carry data in a signal band with 5.84 MHz bandwidth. These 108 data subcarriers are divided into 12 OFDMA user segments, each consisting 8 data subcarriers and one pilot subcarrier. Moreover, in order to take advantage of frequency diversity, subcarrier interleaving is applied to the 9 subcarriers belonging to the same OFDMA user segment.
The target maximum load per node is assumed to be 60 Kbps for twenty nodes, hence the target rate of 1.2 Mbps. With this criterion, we tried to choose PHY layer parameters which satisfy the target data rate criteria in relative low transmit power requirements. For example, we limit bandwidth to 5 MHz and modulation scheme only up to 64 QAM to limit power requirements. For a user occupying only one ODFMA segment (9 sub-carriers), modulation of 64 QAM, 2/3 coding rate, and including the effect of the guard bands and pilots, the net data rate would be 1.5 Mpbs. PHY parameters can be adjusted to achieve even higher data rates. For instance, the user can occupy more than one OFDMA segments or BW can be increased.
2.3 Frame structure
In the proposed wireless system, each frame is 200 ms and it is divided into four 50 ms sub-frames. Each sub-frame contains five packets, namely, ACK (acknowledgement) packet, neighbor discovery packet, RTS/CTS (request to send/clear to send) packet, and data packet. These packets are transmitted sequentially to make up one sub-frame, as shown in Fig. 2.

Frame structure of the proposed system
RTS and CTS packet consist of preambles 1, 2, and a data part of Fig. 3

Preamble design. a Packet format of the neighbor discovery packet. b Structure of the preamble of the first kind
. The data part of the RTS packet has 14 OFDM symbols and contains the information of user index, target user index, MCS, number of packets to be transmitted, and the CRC code. Similarly, the data part of the CTS packet has 32 OFDM symbols and carries user information such as user indices of the transmitters, indices of OFDMA user segments used by the transmitters, updated available memory amount, and the CRC code.
The data packet is composed of preambles 1, 2, and a data part (payload), which contains the vital sign data. The length of the payload depends on the amount of data to be transmitted. In this system, each packet contains 1K bits of vital sign data and its length varies with the MCS. There are a total of six kinds of MCS to choose from, i.e., three kinds of modulation, QPSK, 16 QAM, and 64 QAM, and two kinds of code rate, 1/2 and 2/3. On the contrary, the control signals, including the neighbor discovery packet, RTS, CTS, and ACK packets, are all modulated by the BPSK modulation and protected by a convolutional code with rate 1/2.
After vital sign data transmission, the receiver would check the CRC code contained in each vital sign data packet to confirm whether the packet information is correctly received or not. This packet reception confirmation would then be transmitted in the ACK packet to the corresponding transmitters, thus informing them about which packets are lost and need be retransmitted. The ACK packet consists of preamble 1, preamble 2, and a data part. The data part contains 26 OFDM symbols and carries the information of the receive user index, user indices of the transmitters, packet reception confirmation, and the CRC code.
The APs broadcast a beacon every 200 ms to help user nodes detect the frame boundary and adjust their oscillator frequency. Besides, in order not to interfere with the OFDMA signal that carries the vital sign data, the central frequency of the beacon is set outside the main frequency band and the bandwidth of the beacon is only 100 KHz.
2.4 Neighbor discovery packet format
The neighbor discovery packet is composed of two parts, the preamble part and the data part, as shown in Fig. 3a. The preamble design facilitates OFDM symbol timing synchronization, carrier frequency offset (CFO) recovery, and channel estimation, which were all discussed in detail in our previous works [13–15]. According to different functions, the preamble can be further classified into three parts.
2.4.1 OFDM symbol boundary estimation
The function of preamble 1 is to help the receiver detect the OFDM symbol boundary. It consists of 8 repeated time-domain sequence “A,” as shown in Fig. 3b. The 64 element sequence “A” can be generated by passing the frequency domain sequence “ A f ” through a 64-point inverse fast Fourier Transform (IFFT) block. The sequence “ A f ” depends on the OFDMA user segment index, as shown in Eq. (1).
where i is the index of OFDMA user segment. To detect symbol boundary, delay correlation method is extended to the multiple antennas, accordingly
where r q [n] is the received signal of the q th antenna at the discrete time “n.” The ideal (noise-free) delay correlation (D C[⋯ ]) output waveform, plotted in Fig. 4, contains seven peaks, from which the OFDM symbol boundary can be estimated.

OFDM symbol boundary estimation
2.4.2 Collision detection and CFO estimation
The function of the second preamble is to help the receiver detect the CFO, OFDMA user segment deployment, and collision. Preamble 2 consists of five OFDM symbols. Consider the frequency domain sequence “S” with 40 elements for a OFDMA user segment,
where “ Z p ” is the sequence generated by cyclic shifting the Zadoff-Chu sequence “ z 0” rightward p point and p∈[ 0,15].
Note that the shift “p” is chosen by the user node, hence this uniquely defines the user in that OFDMA user segment. The sequence “S” is divided equally into five parts of eight elements each, and they are assigned as the frequency-domain data of the five OFDM symbols in preamble 2. In summary, OFDMA is applied to provide 12 user segments (each with one pilot subcarrier and 8 data subcarriers) and within each segment, user preambles are multiplexed via different Zadoff-Chu sequences.
Using the unique property of the Zadoff-Chu sequence that circular shifted sequences have zero cross correlation, we can detect which sequence exists in the received signal. The correlation function between the received signal (with symbol-to-symbol differential correlation first to remove the per-subcarrier channel response) and the Zadoff-Chu sequence is given by
\(r_{s,\alpha _{ij}}^{q}\) is the received signal on the q th receiving antenna for s th OFDM symbols with α ij being frequency-domain subcarrier index of the j th data subcarrier assigned to the i th. If the i th OFDMA user segment data subcarriers in preamble 2 contains Zadoff-Chu sequence k i , then we will have
Thus, the receiver detects that a user using Zadoff-Chu sequence k i exists in OFDMA user segment i. Presence of more than one users in the same segment is deemed collision. Detecting collision in preamble is one of the unique capabilities of the proposed MAC system, making the protocol more efficient.
The carrier frequency offset is estimated by using our previous work on Joint Weighted Least Squares Estimation (JWLSE) method for frequency and timing offset in OFDM systems [13]. In this method, the phase differences of individual subcarriers are weighted averaged with weights proportional to the squared channel gains in the respective frequencies.
Phase differences are first computed
and then they are weighted by \(w_{s,ij}=|\hat {H}_{s,\alpha _{i}j}|^{2}\). Finally, the CFO estimation is given by
\(\hat {e}_{i,k}^{u}\) can be found using the formulation in [13]. Furthermore, the above estimate can be used to improve the OFDMA user segment detection by including CFO effect
2.4.3 Channel state information
The channel response can be estimated by utilizing the scattered pilots in preamble 3. The pattern of the scattered pilot varies with the index of OFDMA user segment and the preamble is made up of 12 OFDM symbols which can be divided into four groups, each of which consists of three OFDM symbols, corresponding to the four transmit antennas, respectively. The channel state information (CSI) thus collected in the neighborhood discovery phase is later used to generate beamforming vectors for data transmission as will be seen in Section 4.
2.5 Node status information
The node status information is contained in the data part shown in Fig. 3a. This part includes the user index, location coordinates and residue memory amount, the indices of detected users, the detected OFDMA user segment collision information, and the cyclic redundancy check code (CRC code). Information from this part helps other nodes update their neighbor status information. As we have not proposed a routing mechanism in this paper, we use the relative location coordinate to avoid the repeated back-and-forth packet transmission between two nodes.
3 Medium access control
In this section, we present the proposed OFDMA-based MAC for supporting the efficient use of multihop and joint beamforming transmission scheme. As compared to the one priority, one band system, we have lower contention in a four-priority, twelve-OFDMA-segment system. This implies that the packet collision probability is reduced by dividing the time and frequency resources.
3.1 Dynamic network formation with neighborhood discovery
The proposed MAC was designed with a view to providing guaranteed channel access to the high-priority nodes with urgent data delivery needs. This helped us to meet the QoS requirement for vital sign monitoring. As per our survey, the most related MAC protocols to our design are PRIMA [16] and QMAC [17]. Similarities in our design and these include the use of RTS/CTS for channel contention, use of different queues to reflect different levels of latency requirement. Unlike PRIMA, which uses TDMA/CSMA, the proposed MAC used a combination of OFDMA and CSMA in channel access. Nodes in different frequency segments can communicate to the next hop neighbor independently. As routing protocol design is not the aim of the paper, we used a simple RSSI-based forward routing to route data to the sink node via multi-hop. Note that we can extend to using a more complex routing mechanism using clustering and cluster heads as proposed in LEACH [18] and its subsequent improvements in [16, 19]. The proposed design allows those nodes that have no data to go into the sleep state, thus minimizing the idle listening periods that consume significant energy in sensor networks. In this sense, the energy consumption due to sleep cycle and idle listening in our system is the same as PRIMA.
Note that our MAC design is oriented toward supporting the throughput requirement of the health monitoring system, with the peak requirement being 60 kbps for ECG. Hence, in this paper, we will concentrate on meeting the load requirement in our design. Other existing MAC designs like QMAC, PRIMA, WISEMAC [20], and LEACH are geared toward increasing the lifetime of the WSN and are generally designed for applications with lower loads. However, it is worth mentioning that these MAC designs can easily be applied together with our proposed joint beamforming multi-hop approach to achieve an effective and energy-efficient wireless sensor network solution for applications with lower load requirements.
In the proposed wireless network, each user node acquires and maintains the exact knowledge about its neighborhood via a periodic neighbor discovery process. In this process, user nodes of each access class sequentially broadcast neighbor discovery packets to announce their presence and related information. Note that the nodes are divided into access classes depending on the amount of pending data in their queues. Due to this, nodes with higher urgency get higher priority as seen by the packet order in Fig. 5. We assume that the queue capacities are same at all user nodes. During neighborhood discovery, user nodes construct their neighbor node tables by listening to the neighbor nodes of various priority classes, from Access Class IV to Access Class I.

Access priority in neighborhood discovery and RTS/CTS phases
The Access Class priority order of Fig. 5 is followed by both neighborhood discovery and RTS/CTS transmission; therefore, users with higher transmission priority will gain several advantages over users of lower priority.
-
1.
First, since they can transmit their RTS packets earlier than users of access classes with lower priority, the probability of forming a transmission link with their best next-hop target is higher.
-
2.
Second, due to the neighbor node confirmation mechanism, each user can only choose a receiver whose transmission priority is lower than itself, as its next-hop targets. Therefore, users with higher transmission priority would have more next-hop candidates, increasing the probability of forming a transmission link.
-
3.
Third, since users can only be requested to receive data by users whose transmission priority is higher, users with higher transmission priority would have lower probability to be on the receiving end.
Moreover, we can choose different numbers of priority classes, but this will affect the MAC performance. For example, increasing the number of access priority classes will increase the overhead on packet transmission. On the other hand, reducing the number of classes will lead to higher contention in the given time slot. From Fig. 5, we can also see that the choice of sub-frame length should be large enough to include four data packets (one for each access class) and the associated overhead (four neighborhood discovery packets, four RTS/CTS/ACK packets). For the data packet size of 1 Kbyte and the PHY parameters of Table 1, the sub-frame size of 50 ms is chosen.
Due to OFDMA user segment collision and noise, the packet of a certain user may not be correctly received by all its neighbors. Thus, before the RTS/CTS handshaking process, each user node should know which neighboring users can receive its packet correctly. In neighbor discovery process, after correctly receiving the packets of neighboring users, each user would record their user indices and broadcast them in its neighbor discovery packet. In this way, each user can confirm the wireless connections between itself and its neighbors whose transmission priority is lower than it. Then, the user can choose its next-hop target from these neighbors.
3.1.1 OFDMA user segment selection
After joining this network, each user node should select one OFDMA user segment. However, since there are only 12 OFDMA segments, as per observations from our simulation setup, one segment may be used by more than one user at the same time (channel reuse) if the users are separated by enough distance. As such, co-channel interference can occur if separation between nodes of the same segment is not enough.
The user nodes utilize a first-come-first-serve mechanism to select an appropriate OFDMA user segment. When a new user node joins the network, it would first listen to the neighbor discovery packets transmitted by its neighbors to acquire the knowledge about occupied segments in its neighborhood and also available free segments. The best choice is to select a segment that is currently unoccupied (free). In the worst case scenario when all the OFDMA segments are occupied, the decision is made based on received signal strengths (RSS) of users in each segment. When neighborhood interference in an OFDMA segment is low in terms of RSS, the new user can use this segment. In the worst case, when all OFDMA user segments in the current access class are occupied by user nodes with strong RSS (hence high interference), the new user follows two steps: firstly, it waits till a segment becomes free (carrier sensing and back-off) and secondly when this waiting times out and still no OFDMA user segment in the current access class is free, it can lower its access class by one and then search for an available OFDMA segment in that class.
3.1.2 OFDMA user segment collision management
We developed collision management based on the philosophy of avoiding collision and apply corrective measures when collision is detected to reduce the collision possibility. The user node that detects collision in an OFDMA user segment will broadcast this information in its next neighborhood discovery packet. The users whose packets collided would receive this information and choose another unoccupied segment after a random back-off period. If there is no free segment, the node will lower its access class by one and try to find a free user segment such that it will not be idle in this sub-frame.
3.1.3 Network latency reduction mechanism
To minimize the total network latency of the proposed wireless sensor network, we allow user nodes to adjust their own access classes to reduce the latency caused by user collision in OFDMA user segments. Since in our wireless multi-hop network, the transmission links are established by user nodes through handshaking mechanism. If too many user nodes attempt to make transmission links with the same user node, there will be a bottleneck, thus increasing network latency.
Since each user node can detect all OFDMA user segments, it has information about neighborhood congestion, e.g., number of nearby users and number of occupied segments. Furthermore, user nodes also broadcast this congestion information through the neighbor discovery packet. Therefore, when a user node detects network congestion, it will choose the least congested node as the target. The extreme case of network congestion is network deadlock. If a network deadlock occurs, every user node will not receive any neighbor discovery packet. To solve network deadlock, we let user node change its own transmission priority class if it does not receive any packet at neighbor discovery stage. In this way, the network deadlock problem is resolved in a maximum of four sub-frames (one frame). Thus, we can summarize that changing the access class is a mechanism to avoid congestion in a particular access class. Hence, the nodes can change the access class in the following cases
-
To locate a free OFDMA segment to transmit
-
To avoid repetitive neighborhood discovery packet collision
-
To reduce latency when there is higher pending data in its queue
-
When there is no reception of neighborhood discovery packet in a sub-frame
4 Energy efficient data transmission with joint beamforming
4.1 Adaptive transmission
As users with higher transmission priority have improved odds of forming links in our proposed system, thus the data transmission efficiency of the system is enhanced. For each user, the function of the RTS packet is to inform its target about the transmission parameters, such as the number of packets and the modulation and coding scheme (MCS). The decision flow of these transmission parameters is shown in Fig. 6. The user would first calculate the maximum number of packets it can transmit according to the available memory amount of its target. Next, considering the data rate, the MCS can also be decided. Then, the equivalent signal to interference and noise ratios (SINR) of the eight data subcarriers after using beamforming are compared with the SNR thresholds corresponding to the chosen MCS. The SNR thresholds corresponding to different MCSs are given in Table 2 (obtained from simulation in Section 6). If the minimum of the equivalent SINR of the eight data subcarriers is not above the SNR threshold, then this MCS is not robust enough to protect the data from the noise and fading in the current channel. Therefore, the user needs to choose a more robust MCS with lower modulation order and/or lower code rate. Then, the minimum of eight equivalent SINRs is again compared with the new SNR threshold. This process continues until the minimum equivalent SINR is above the threshold. Finally, the user would try to lower transmission power such that the minimum equivalent SINR stays just above the SNR threshold. Using the proposed transmission MCS decision and power control mechanism, the users will transmit their data in an energy efficient way.

Decision flow of the transmission parameters
4.2 CSI-based joint beamforming
A target receiving node can accept one or several transmission requests from different users as long as it has large enough free memory to hold the data to be transmitted. The receiving node will broadcast a CTS packet containing the indices of the OFDMA user segments used by the allowed transmitters. After the RTS/CTS handshaking process, each transmission pair would use joint transmitter-receiver beamforming technique to transmit and receive the vital sign data as shown in the Fig. 2 frame structure. The user nodes take the CSI gathered (channel matrix \(\hat {H}_{\alpha,\beta }^{i}\), i th subcarrier for transmitter α and receiver β) to calculate the beamforming vectors using the MRC/MRT scheme [21]. The transmit beamforming vector is v i , which is the right singular vector of the \(\hat {H}_{\alpha,\beta }^{i}\) corresponding to the largest eigenvalue. Following this, the receive beamforming vector chosen at the receiving end is given by
The SINR calculated at the transmitter for the i th subcarrier is formulated as
where \(\hat {\sigma }^{2}\) is the noise power (including interference) calculated in the network discovery phase. As mentioned before, this SINR is compared to a threshold SNR (SNR th ) which is needed for successful transmission. The transmission power is reduced to until we reach a point when the above SNR constraint (SNR i >SNR th ) does not allow further transmission power reduction.
Along with OFDMA, the use of beamforming allows for multiple transmission links to exist simultaneously thus providing multiple access as shown in Fig. 7. It should be noted that the beam patterns indicate that the energy spread is directional toward the other node in each link, indicating high energy efficiency. As the simulation uses channel models with multipath fading effect, the MRC/MRT beamforming patterns may not always align with steering angles exactly. Furthermore, CSI is only available after neighborhood discovery phase; hence, beamforming vectors are not used in neighborhood discovery phase. Moreover, the receiver uses the parallel interference cancelation (PIC) based on the scheme in [22]. This allows to the receiver to reduce ICI as well as MUI.

Sample links and the associated TX/RX beam patterns formed after RTS/CTS session
5 Baseband transceiver architecture
Figure 8 shows the architecture of the OFDMA baseband transmitter. The input bit stream is first appended by a cyclic redundancy check (CRC) code and then passed through the scrambler, convolutional encoder, and interleaver. Then, the coded bit stream is mapped into complex symbols by the constellation mapping block. After inserting the preamble and multiplying the coefficients of the transmit beamforming vector, four spatial streams are generated, where the transmit beamforming vector is calculated by using the estimated CSI and the uplink-downlink duality [23] characteristic as described in Section 4. The four spatial streams then pass through inverse fast Fourier transform (IFFT) to form the time-domain OFDM symbols and the cyclic-prefix guard intervals are inserted to prevent inter-symbol interference. Finally, the time-domain signals are sent to the analog and RF front end for wireless transmission over the antenna array.

Baseband transmitter architecture
The architecture of the OFDMA baseband receiver is shown in Fig. 9, and it can be divided into four parts. The first part is responsible for beacon detection, including the frame boundary estimation and the adjustment of the numerical controlled oscillator (NCO) frequency to compensate for frequency offset of the local carrier signal in the RF frontend. The second part is used to detect the OFDM symbol. The received signal is first passes through a low pass filter to filter out the beacon signal. Due to the periodicity of preamble 1 waveform, the OFDM symbol boundary can be accurately estimated by a simple delay-and-correlate as mentioned in Section 2. The time-domain signal is transformed to the frequency domain by an FFT block. Next, preamble 2 is used to detect the OFDMA user segment deployment/collision by utilizing the auto-correlation property of the Zadoff-Chu sequence, as introduced in Section 2. This information is passed on to the MAC layer control block.

Baseband receiver architecture
The fourth part includes the carrier frequency offset (CFO) estimation obtained by the JWLS estimator as mentioned in Section 2. This part is also responsible for the channel estimation and the demodulation and decoding of the received data. Taking advantage of the scattered pilots contained in preamble 3 of the neighborhood discovery packets, accurate channel state information (CSI) can be acquired using the shifted raised cosine interpolator [14]. The CSI is then used to calculate the receive beamforming vector by the maximum ratio combining method. Finally, with the help of the receive beamforming vector and the estimated CSI, the four spatial streams received by the four receive antennas are combined into one data stream, which then passes through the one-tap equalizer, de-mapper, de-interleaver, Viterbi decoder, and de-scrambler to recover the transmitted bits. The receiver also estimates the noise power from the CSI and the correctly received symbols, which are then used to calculate the equivalent SINR.
6 Simulation results
In this section, we present simulation results of the proposed system. The entire network simulation was designed and tested in Matlab including the MAC and PHY layers. The system is evaluated with the IEEE 802.11 TGn MIMO channel model B [24] and UWB CM4 path loss model which is a proposed model for body surface node to an external node in IEEE 802.15.6 [25]. Since the user of the proposed system would have very low mobility, e.g., patients in a hospital, we assumed a block fading channel with coherence time of 200 ms and the channel has the characteristic of uplink-downlink duality, \(H_{12}=H_{21}^{H}\), where H 12 and H 21 are the uplink and downlink channel matrices respectively. As for the antenna model, we assumed a cylindrical array and the distance between the two neighboring antennas is half the wavelength of the carrier signal (centered at 5 GHz) leading to a diameter of 3.8 cm.
The coded packet error rates (PERs) versus SNR for different MCSs with and without joint beamforming technique are illustrated in Fig. 10a, b, respectively, for TGn B MIMO channel. From these, we can see that the joint beamforming technique can indeed effectively enhance the quality of the received signal and reduce the SNR required to attain a certain PER performance. In addition, we had defined the SNR thresholds for choosing different MCSs from these PER simulation results, as shown in Table 2.

Coded PER (TGn channel B). a Coded PER with beamforming. b Coded PER without beamforming
We further analyzed the average number of hops needed by a node to transmit its data to an access point (AP). Here, we consider a network scenario with nodes of two access classes “I” and “II,” as shown in Fig. 11a, with node “0” as the sink node (AP). The numbers inside the circles/diamonds denote the average number of hops required by the user node to transfer its vital sign data packet to the AP. As expected, the required hops increases with the distance between the node and the AP. As the nodes choose the minimum possible transmission power satisfying the SNR constraint, the number of hops required is the largest possible. Therefore Fig. 11a shows the worst case number of hops needed for this network topology. The equi-hop contours shown in Fig. 11a indicate that very few nodes need more than four hops to reach the sink, which indicates that the neighborhood discovery mechanism is efficient.

Number of hops and throughput for simulation time of 2 s. a Average number of hops needed by user nodes. b Throughput at the AP
Furthermore, Fig. 11b shows the amount of vital sign data received by the AP within 2 s of simulation for two network scenarios (input load of 60 Kbps). The first network scenario consists of nodes distributed in a linear fashion, with sink node at one end. The second network scenario has equal node density with the sink node at center. These two network scenarios depict the worst and the best case node distribution, respectively. As we can see, when the system operates at an adequate RF transmission power, the received data amount is around 2400 Kbits, which is about the amount of vital sign data generated by the 20 users in the network in the 2-s interval. Therefore, the minimum transmission power for network topology 1 should be 8 dBm and that for network topology 2 should be 2 dBm.
6.1 Comparison with 802.15.4 and 802.15.6
In Fig. 12, we further analyzed the average packet transmission latency affecting each user node in the network when transmitting their packets to the AP. For the simulation in Fig. 12, we use 20 nodes, SNR of 24 dB and each node produces data at varying load ranges from 0.5 kbits/s to 60 kbits/s. As we can see from Fig. 12, when the load is varied, the average packet transmission latency is about 180–280 ms for the proposed system which suffices ECG. The latency of the proposed system can further be improved by adjusting the PHY parameters of Table 1 to increase the data rate as explained in Section 2. For example, if we increase our BW from 5.84 to 8.76 MHz, we can increase the system throughput from 1.2 to 1.72 Mpbs, which would effectively reduce the packet transmission time. Moreover, the MAC latency is also reduced in our system by assigning the node with stricter latency needs to higher priority class. This can be further enhanced by assigning more than one OFDMA slot to a user node. For example, the transmission latency for a node can be reduced by approximately 30% by doubling its slot assignment (assuming a low 60% MAC efficiency). Comparing this with the average latency from the 802.15.4 model of [26, 27] using RTS/CTS and maximum data rate 250 Kbps, we can see that the 802.15.4 has significant higher latency when the load is greater than 30 Kbps. This is expected as the focus of conventional sensor networks based on 802.15.4 is energy saving low-data rate systems (up to 250 Kbps) hence should not be considered for sum loads up to 1.2 Mbps. Subsequently, we turn our attention to comparisons with 802.15.6 where the achievable data rates are in the order of several Mbps.

Network latency for different input traffic loads
In the Fig. 13a, we compare the throughput of the proposed system and 802.15.6 in slotted aloha mode for different traffic loads at the nodes. The medium access throughput and energy consumption for slotted aloha mode and CSMA/CA mode of 802.15.6 have been analyzed in [28]and [29], respectively. Considering the similarities, we chose slotted aloha 802.15.6 for comparison with the proposed system. Note that centralized scheduled access mode of IEEE 802.15.6 can be used for local WBAN, e.g., nodes connected to the human body with a single AP at a nearby distance (about 5 m). In our network scenario in which more nodes are spread over a larger distance as shown in Fig. 11, centralized scheduled access will need higher coordination and overhead. Thus, performance comparison between slotted aloha and scheduled access mode of 802.15.6 for such networks is an interesting topic of research but beyond the scope of our following discussion. Considering twenty nodes and throughput of 1.2 Mbps at the AP (60 Kbps/node), we used priority class 1 for a more stringent comparison. The coded data rate for 802.15.6 is varied from 0.243 to 3.9 Mbps as per Table 68 in [30] to achieve the different target data rates. The only higher coded data rate mentioned in Table 68 in [30] is 7.8 Mpbs, which can achieve higher throughput, but it would be at higher power consumption cost. Hence, we chose only the PHY parameters that suffice our maximum data rate requirement of 1.2 Mbps. As seen in Fig. 13a, choosing the right set of PHY parameters, the slotted aloha mode of 802.15.6 can achieve almost equivalent throughput compared to the proposed system. But note that the coded data rate used in these varies from 243 Kbps to 3.9 Mbps, hence we have to analyze the power consumption cost for achieving this throughput. The receiver sensitivity reference for power consumption measure is obtained using Table 73 of the 802.15.6 standard [30]. Figure 13b shows though the slotted aloha mode achieves the throughput similar to the proposed system, it uses larger average transmit power to achieve this goal. The two major contributors to higher transmit power are the slotted aloha MAC efficiency and one hop link distance. Due to larger one hop distance in our network scenario of Fig. 11, the transmit power requirement for some nodes is beyond the 0 dBm limit of 802.15.6. The power efficiency advantage of the proposed system is to be expected not only because of the multi-hop transmission scheme but also because joint beamforming improves the link SNR as previously shown in Fig. 10 and Table 2.

Throughput and power comparison with 802.15.6 slotted aloha. a Throughput comparison. b Average data transmission power comparison
The energy in mJ required over the entire simulation period is divided by the number of users and simulation time to calculate the average data transmission power in mJ/s. The total energy required over the entire simulation period is given by energy required to transmit one packet (Eq. 7) multiplied by the number of packets transmitted in the simulation period. These transmitted packets include all packets of Fig. 2, i.e., RTS/CTS, neighborhood discovery, data, ACK for all successful and unsuccessful transmission attempts.
6.2 Energy efficiency
Power consumption being an important metric for battery-powered sensors, we used the link budget analysis [31] to estimate the required packet transmission power. First, we estimated the noise power using
where N is the noise power, k is the Boltzmann constant, T is the temperature, and B is the system bandwidth. As some of the sensor nodes are placed in vicinity or surface of the human body, the path loss model of UWB CM4 channel was chosen based on [25] for which the path loss including shadowing was found to be about 12 dB higher than the TGn B model. Then, we could calculate the receiver sensitivity of different MCSs.
where P rx is the receiver sensitivity, N rx is the noise figure, and SNR is the SNR thresholds of the different MCS. The SNR thresholds for UWB CM4 were found to be about 7 dB higher than TGn thresholds listed in Table 2. Finally, the required packet transmission power can be estimated by Eqs. (6) and (7).
where S(d) is the standard deviation of the shadow fading, P(d) is the path loss, d is the distance between transmitter and receiver, P tx is the RF transmission power, G tx and G rx are the antenna gains.
where E packet is the required packet transmission energy and T packet is the time duration of a packet.
Using the parameters in Table 3 and Eq. (7), we could obtain the average required data transmission power of three different transmission methods when different SNR levels are used in the simulation. The direct transmission method used fixed worst-case transmission power for all nodes in the system, regardless of the SNR. The results in Fig. 14a show that the average transmission power required by the multi-hop transmission scheme is lower than that of the direct transmission scheme due to shorter links between transmitters and receivers. Moreover, joint beamforming technique can reduce the transmission power further due to improved SINR from lower signal energy spread in space. Take SNR level of 24 dB as an example, comparing with the direct transmission method, the two proposed methods can save transmission power of 591.1 and 627 mW, respectively. Furthermore in Fig. 14b, we can see that when using equal RF transmission power, the throughput of the system using a combination of both multi-hop and joint beamforming transmission scheme is significantly better than the system using only multi-hop transmission scheme. This is an expected result as joint beamforming improves the channel SNR as per Table 2, resulting in a higher choice of MCS via adaptive modulation and hence improved throughput. Moreover the average data transmission power is not only based on the path loss model (link distance), but also on other parameters such as
-
Medium access efficiency based on retransmission, collision, etc.
Fig. 14 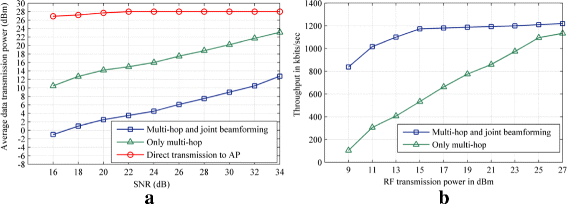
Power and throughput requirements for different transmission methods. a RF power comparison. b Throughput comparison
Table 3 Link budget -
MCS used to achieve the required link data rate and PER

Energy efficiency of the multi-hop scheme is therefore achieved by the improved MAC performance, along with the shortened links. As multi-hop networks use lower transmit power, they indirectly support larger frequency reuse and lower interference in OFDMA segments. Joint beamforming on the other hand also reduces the SNR threshold needed to achieve a particular target PER, leading to lower MCS usage and lower power requirement.
6.3 Circuit complexity
We used Quartus FPGA board, STRATIX III EP3SL150F1152C2N, to implement and verify the baseband transceiver hardware architecture. The FPGA hardware specifications are shown in Table 4. Although FPGA implementation does not aim to get the optimum hardware synthesized results, but the FPGA verification verifies the circuit complexity and feasibility of the proposed system including the baseband transceiver.
To consider all aspects of energy consumption, we compute the number of addition and multiplication operations required by each block in the receiver and use the power efficiency of ARM Cortex TM-A5 multiprocessor [32] as reference to estimate the required circuit processing power of these three different transmission methods and list the results in Table 5.
6.4 Discussion
It is clear that multi-hop transmission can effectively enhance the energy efficiency of the system, since a large amount of transmission power can be saved at the price of an increase of 1.23 mW circuit processing power. However, for the joint beamforming technique, the required circuit processing power would increase by 7.15 mW when compared to the multi-hop only scheme. Therefore, the nodes should take the transmission distance, MCS and the overhead on circuit processing power into consideration and selectively apply the joint beamforming technique. This is because, in some cases, using multi-hop transmission has already reduced the required transmission power significantly. Further applying the joint beamforming technique saves only little transmission power.
Fortunately, considering the use of ASIC implementation and the progress of the semi-conductor technology, further reduction of the required circuit processing power of both the baseband transceiver and the RF front end can be expected and the energy efficiency of the system can thus be further enhanced. There have already been many improvements in the technology from ARM Cortex–A5 to ARM Cortex–A32 (v8-A architecture). Some improvements in technology already have made more power savings possible on ARM processors. For example, the big.LITTLE configuration in Cortex-A7 [33] promised significant power saving of up to 75% over Cortex-A5. Hence the circuit power mentioned in Table 5, should only be considered as a complexity reference for comparing the different transmission schemes rather than an precise numerical value. Therefore, the actual choice of beamforming at a node should be made judiciously on factors such as
-
Transmit power saving based on link distance. For example, if the link distance is already very small due to multi-hop, in the current scenario node should disable beamforming to save on circuit power. Whereas on a longer link distance, the use of beamforming could be a better option to save on transmit power.
-
Circuit power needed to implement the design on a given processor
-
Beamforming should be useful for higher node density networks. As ideally beamforming also reduces the interference footprint in the neighborhood of the transmitter and receiver, leading to better SNR for other transmissions.
-
Size of the sensor might restrict the use of the number of antennas. For example, two antenna beamforming would require an antenna distance of 1.9 cm on 5 GHz band. Apart from lower interference in 5 GHz band compared to the 2.4 GHz band, the smaller antenna spacing is another important advantage. Hence for smaller sensors needing to use beamforming, it would be advantageous to use higher frequencies for smaller antenna spacing.
Some research areas can be considered to further improve the system proposed in this paper. For instance, adjusting PHY parameters globally with changing network scenarios. An example of this would be dynamic ODFMA segment allocations when number of nodes changes or the traffic load requirement changes. MAC layer contention can be improved with assistance from the AP, e.g., the scheduled access mode in WBAN or restricted access window similar to IEEE 802.11ah. Packet routing strategy has not been a part of this study, leading to us using a simple RSSI based routing. Comparing different centralized and distributed routing mechanism can also be considered as part of future research.
7 Conclusions
In this paper, an energy-efficient wireless communication system and its baseband transceiver architecture were proposed for an information gathering sensor network. The system provides a steady and low-latency data transmission service by applying the OFDMA technique with a novel MAC based on neighborhood discovery. Moreover, by introducing the multi-hop transmission and joint beamforming technique, the system saves a significant amount of data transmission power. In addition, the baseband transceiver architecture tailored for this system was designed and implemented. Finally, numerical simulation results of the throughput rate and the packet transmission latency proved the effectiveness of the system under varying loads. The required data transmission power and circuit processing power were also analyzed to validate the energy efficiency of the proposed system.
References
C Worringham, A Rojek, I Stewart, Development and feasibility of a smartphone, ECG and GPS based system for remotely monitoring exercise in cardiac rehabilitation. PLoS ONE. 6(2), e14669 (2011). https://doi.org/10.1371/journal.pone.0014669.
PJ Soh, GAE Vandenbosch, M Mercuri, DMMP Schreurs, Wearable wireless health monitoring: current developments, challenges, and future trends. IEEE Microw. Mag.16:, 55–70 (2015).
MM Rodgers, VM Pai, RS Conroy, Recent advances in wearable sensors for health monitoring. IEEE Sensors J.15:, 3119–26 (2015).
M Ghamari, H Arora, RS Sherratt, W Harwin, in Comparison of low-power wireless communication technologies for wearable health-monitoring applications. Proceedings of the International Conference on Computer, Communications, and Control Technology (I4CT) (IEEEKuching, 2015), pp. 1–6.
PT Hiep, NH Hoang, R Kohno, Performance analysis of multiple-hop wireless body area network. J. Commun. Netw.17(4), 419–27 (2015).
AU Rajan, KRS V, A Jeyasekar, AJ Lattanze, Energy-efficient predictive congestion control for wireless sensor networks. IET Wirel. Sens. Syst.5(3), 115–23 (2015).
D Du, F Hu, F Wang, Z Wang, Y Du, L Wang, A game theoretic approach for inter-network interference mitigation in wireless body area networks. China Commun.12(9), 150–61 (2015).
X Liu, Y Zheng, B Zhao, Y Wang, MW Phyu, An ultra low power baseband transceiver ic for wireless body area network in 0.18- μm cmos technology. IEEE Trans. Very Large Scale Integr. (VLSI) Syst.19(8), 1418–28 (2011).
LH Wang, TY Chen, KH Lin, Q Fang, SY Lee, Implementation of a wireless ECG acquisition SoC for IEEE 802.15.4 (ZigBee) applications. IEEE J. Biomed. Health Inform.19(1), 247–55 (2015).
X Yu, M Wei, Y Yin, Y Song, S Han, Q Liu, Z Jin, X Liu, Z Wang, Y Sun, B Chi, A fully-integrated reconfigurable dual-band transceiver for short range wireless communications in 180 nm cmos. IEEE J. Solid-State Circ.50(11), 2572–90 (2015).
K Ban, S Horikawa, K Taniguchi, T Kogawa, H Kasami, in Proceedings of the Vehicular Technology Conference (VTC Spring), 2013 IEEE 77th. Digital baseband IC design of OFDM PHY for a 60GHz proximity communication system (IEEEDresden, 2013), pp. 1–5.
JM Lin, HP Ma, A high performance baseband transceiver for siso-/mimo-ofda uplink communications. IEEE Trans. Wirel. Commun.8(7), 3330–4 (2009).
PY Tsai, HY Kang, TD Chiueh, in Proceedings of the Vehicular Technology Conference, 2003. VTC 2003-Spring. The 57th IEEE Semiannual, vol. 4, 4. Joint weighted least squares estimation of frequency and timing offset for OFDM systems over fading channels (IEEEKyoto, 2003), pp. 2543–74.
PY Tsai, TD Chiueh, Adaptive raised-cosine channel interpolation for pilot-aided OFDM systems. IEEE Trans. Wirel. Commun.8(vol. 2), 1028–37 (2009).
TD Chiueh, PY Tsai, IW Lai, Baseband Receiver Design for Wireless MIMO-OFDM Communications, 2nd Ed (Wiley-IEEE Press, Singapore, 2012).
J Ben-Othman, L Mokdad, B Yahya, in 2011 IEEE International Conference on Communications (ICC). An energy efficient priority-based QoS MAC protocol for wireless sensor networks (IEEEHangzhou, 2011), pp. 1–6.
Y Liu, I Elhanany, H Qi, in IEEE International Conference on Mobile Adhoc and Sensor Systems Conference, 2005. An energy-efficient qos-aware media access control protocol for wireless sensor networks (IEEEWashington DC, 2005), pp. 3–191.
WR Heinzelman, A Chandrakasan, H Balakrishnan, in System Sciences, 2000. Proceedings of the 33rd Annual Hawaii International Conference On. Energy-efficient communication protocol for wireless microsensor networks (IEEE Computer societyHawaii, 2000), pp. 10–2.
N Wang, H Zhu, in Computer Science and Electronics Engineering (ICCSEE), 2012 International Conference On, 2. An energy efficient algrithm based on leach protocol (IEEEHangzhou, 2012), pp. 339–42.
A El-Hoiydi, J-D Decotignie, in Algorithmic Aspects of Wireless Sensor Networks. 2nd edn., 3121. Wisemac: An ultra low power MAC protocol for multi-hop wireless sensor networks (SpringerNew York, 2004), pp. 18–31.
TKY Lo, Maximum ratio transmission. IEEE Trans. Commun.47(10), 1458–61 (1999).
An interference-cancellation scheme for carrier-frequency offsets correction in OFDMA systems. IEEE Trans. Commun.53(1), 203–4 (2005).
P Viswanath, DNC Tse, Sum capacity of the vector gaussian broadcast channel and uplink-downlink duality. IEEE Trans. Inf. Theory. 49(8), 1912–21 (2003).
V Erceg, L Schumacher, P Kyritsi, et al., TGn Channel Models. Version 4. IEEE 802.11-03/940r4, May 2004.
KY Yazdandoost, K Sayrafian-Pour, Channel model for body area network (BAN). IEEE P802.15-08-0780-09-0006. (2009).
MZ n. Zamalloa, B Krishnamachari, An analysis of unreliability and asymmetry in low-power wireless links. ACM Trans. Sensor Netw.3(2) (2007).
MH Zayani, V Gauthier, D Zeghlache, in 2011 7th International Wireless Communications and Mobile Computing Conference. A joint model for ieee 802.15.4 physical and medium access control layers (IEEEIstanbul, 2011), pp. 814–9.
MS Chowdhury, K Ashrafuzzaman, KS Kwak, Saturation throughput analysis of IEEE 802.15.6 slotted aloha in heterogeneous conditions. IEEE Wirel. Commun. Lett.3(3), 257–60 (2014). doi:10.1109/WCL.2014.021714.140008,.
BH Jung, RU Akbar, DK Sung, in 2012 IEEE 23rd International Symposium on Personal, Indoor and Mobile Radio Communications - (PIMRC). Throughput, energy consumption, and energy efficiency of ieee 802.15.6 body area network (ban) mac protocol (IEEESydney, 2012), pp. 584–9. doi:10.1109/PIMRC.2012.6362852.
IEEE Std 802.15.6-2012, Ieee standard for local and metropolitan area networks - part 15.6: Wireless body area networks, 1–271 (2012). doi:10.1109/IEEESTD.2012.6161600.
RPF Hoefel, in Proceedings of the Canadian Conference on Electrical and Computer Engineering,. IEEE WLANS: 802.11, 802.11e MAC and 802.11a, 802.11b, 802.11g PHY cross layer link budget model for cell coverage estimation (IEEENiagara Falls, 2008), pp. 001877–82.
ARM Cortex TM-A5 Processor Introduction. http://www.arm.com/products/processors/cortex-a/cortex-a5.php. Accessed 6 June 2016.
ARM Cortex TM-A7 Bit.Little Processing. https://developer.arm.com/technologies/big-little. Accessed 18 Mar 2017.
Funding
This work was supported in part by the Ministry of Science and Technology (MOST), Taiwan, under Grant MOST104-2221-E-002 -075-MY2.
Author information
Authors and Affiliations
Contributions
Our research group leader T-DC promoted the idea of combining joint beamforming and multihop transmission scheme. He has supervised the entire development process of this paper. F-KC proposed the MAC layer based on OFDMA and neighborhood discovery. He was involved in developing the MAC and PHY layer simulation model in Matlab. BP developed the simulations relating to channel model, 802.15.4 and 802.15.6. He was responsible for compiling the manuscript for the paper and literature survey to improve different aspects of the proposed system. C-HT was involved in functional verification of the baseband design and FPGA circuit implementation. Our research group has worked as a cohesive unit during the development of the proposed paper. Hence, the above explanation of contribution is only a brief summary for reference and does not encompass all the different challenges that were resolved by teamwork. All authors read and approved the final manuscript.
Corresponding author
Ethics declarations
Competing interests
The authors declare that they have no competing interests.
Publisher’s Note
Springer Nature remains neutral with regard to jurisdictional claims in published maps and institutional affiliations.
Rights and permissions
Open Access This article is distributed under the terms of the Creative Commons Attribution 4.0 International License (http://creativecommons.org/licenses/by/4.0/), which permits unrestricted use, distribution, and reproduction in any medium, provided you give appropriate credit to the original author(s) and the source, provide a link to the Creative Commons license, and indicate if changes were made.
About this article

Cite this article
Pandya, B., Chuang, FK., Tseng, CH. et al. An energy-efficient communication system using joint beamforming in multi-hop health monitoring sensor networks. J Wireless Com Network 2017, 172 (2017). https://doi.org/10.1186/s13638-017-0957-5
Received:
Accepted:
Published:
DOI: https://doi.org/10.1186/s13638-017-0957-5