- Research
- Open access
- Published:
Optimization of cold chain logistics distribution network terminal
EURASIP Journal on Wireless Communications and Networking volume 2018, Article number: 158 (2018)
Abstract
By studying the development status of cold chain logistics in China, and the current situation in the three specific industries of electronics commerce, supermarkets, and the food and beverage industry, this paper analyzes and concludes that the terminal logistics distribution capacity of the regional distribution centers in Chinese cities is insufficient. In order to solve this problem—based on the idea of joint distribution—the paper makes a specific study of the terminal problem and establishes a joint distribution node. Different distribution schemes are adopted for individual, medium, and large customers, and we find that the semi-trailer is used to carry out the transportation of jammers by using mathematical modeling and time window constraint analysis, which can effectively integrate cold chain logistics resources, save logistics space and human resources, and improve terminal logistics distribution capacity.
1 Introduction
The overall development level of the cold chain logistics industry in China is still relatively low. Relative to trunk logistics, terminal logistics distribution has many characteristics, such as many links, a wide service range, and complex and unfixed distribution lines [1]. Moreover, cold chain logistics has exacting requirements for storage conditions and transportation temperature. This makes the terminal distribution capacity of the regional distribution centers of our country insufficient, and seriously restricts the efficient operation of the entire logistics system [2].
The electronics commerce, supermarkets, and the food and beverage industry should be combined by using joint distribution [3], with the third-party cold chain logistics company distributing jointly to improve the speed of distribution, fully realize the integration of cold chain logistics resources, and improve the operational efficiency of the logistics operation.
2 Methods
The vehicle routing problem (VRP) was first raised by Dantzig and Ramser in 1959. The research goal of this problem is to design appropriate routes for a series of customer demand points, so that vehicles can move in an orderly manner, and meet certain constraints (such as the demand for goods). Under the conditions of delivery quantity, delivery time, vehicle capacity limit, mileage limit, time limit, etc., certain optimization objectives (such as the shortest mileage, the least cost, the least time, a smaller fleet size, and a higher vehicle utilization ratio) can be achieved.
Joint distribution means that multiple customers are provided with distribution services by a common third-party logistics company. It is carried out under the unified planning and dispatching of the distribution center.
3 Analysis of the present state of cold chain logistics terminal distribution
-
(1)
The current state of the distribution of electronic commerce industry:
Firstly, it is difficult to save fresh goods, and there is too much loss of fresh goods in the course of circulation. A fresh cold chain business has high demands on the time of receipt of fresh goods, and difficulty in returning them after sale. Some goods with a short shelf life can only be abandoned.
Secondly, the cost of cold chain distribution is high. The domestic third-party cold chain logistics distribution network is not mature, while a self-built cold chain distribution center needs a very large investment with a long payback time. Small and medium enterprises have difficulty with this undertaking.
Thirdly, the supply of fresh products is seasonal. Non-standard, high-end fresh goods occasionally occur out of stock, although they are limited by seasonal influence. This circulation has no scale [4, 5].
-
(2)
The present state of logistics distribution in supermarkets industry:
Firstly, there are too many self-distribution centers. Domestic supermarket chains like to build their own logistics centers, thus making it impossible for many distribution centers to meet the needs of supermarkets.
Secondly, there is a wide range of goods with high distribution requirements. Supermarkets also find it difficult to find suitable distribution companies; as a result, few supermarkets choose a third-party logistics distribution model.
Thirdly, the proportion of a uniform distribution model is very low, and operation is difficult. At present, the proportion of a uniform distribution model is low in supermarket chains, leading to the high cost of cold chain logistics, and traditional logistics companies with single transportation and warehousing as the main business are difficult to adapt.
-
(3)
The present state of distribution logistics in the catering industry:
Catering is mainly influenced by upstream food quality and product performance. Extending upstream industries can strengthen the control of product quality, while extending downstream industries can control the sales channels [6].
The main reason for having too many food supply chain links is the lack of cold chain logistics, which is also a natural barrier to achieving standardization. Mass production can promote supply stability, while cold chain logistics can reduce circulation. More and more catering enterprises try to innovate their food supply chain by optimizing their supply chain management to reduce costs and improve distribution efficiency.
Through analyzing the current state of the electronic commerce cold chain distribution, supermarket cold chain distribution, and the restaurant cold chain distribution, we conclude that the three industries have many problems in common [7].
4 Specific solutions for the cold chain end problem, based on the idea of joint distribution
The third-party cold chain logistics company carrying out joint distribution should coordinate the delivery time of the electronics commerce and supermarkets and the food and beverage industries, and the distribution routes and delivery methods should be chosen logically. Realizing the integration of resources would improve the efficiency and competitiveness of the cold chain distribution [8].
-
(1)
Joint distribution node framework design
Joint distribution is composed of two layers. The first layer is the common distribution structure of a city distribution center. The second common distribution layer of a city distribution center is composed of the newly created nodes. The main function of the final common distribution node is to be responsible for the objects that will be shipped from the city distribution center, coordinating the common distribution point for the last mile, as shown in Fig. 1.
-
(2)
Specific solutions for the end distribution

Dendrogram of double-layer distribution structure. Joint distribution is a collection of goods by third-party logistics enterprises; enterprises or businesses will transfer the goods to the transporters. Then the goods will be transported by the transporters to the local customers. This is a kind of distribution mode dominated by the third-party logistics company, because the third-party logistics company has the specialized operation level and the management experience; at the same time, it can serve for many enterprises, so it can deal with the adverse influence of the fluctuation of the business volume. It mainly includes logistics, information flow, and capital flow. Logistics flows from third-party logistics distribution center to terminal customer, information flows from terminal customer to third-party logistics distribution center, capital flows from terminal customer to third-party logistics distribution center. It is a double-tier distribution structure
The respective demand characteristics of the electricity supplier, the supermarkets, and the three industries at the end of the distribution can be split into three groups: individual customers, large customers, and medium-sized customers. For these three different distribution bodies, the solutions used are in the form of crowdsourcing logistics, assembly distribution, and vehicle transportation, as shown in Fig. 2.
-
(3)
The individual solution

Solution diagram for customers of different sizes. For three different sizes of customers, we should take different distribution methods. For large-sized customers, we should adopt the method of whole vehicle transportation. This method can improve the efficiency and speed of distribution. For medium-sized customers, it will be good to take the form of assembly distribution; it can make full use of logistics resources and reduce the transport mileage. Aiming at individual customers, it will be good to adopt crowdsourcing logistics, crowdsourcing logistics can make full use of social resources and Internet resources to serve logistics, and solve the problem of terminal distribution
Because individual customers will use a crowdsourcing logistics mode to distribute their cold chain goods, adopting a crowdsourcing logistics mode in the city terminal distribution node saves the cold chain logistics company more money [9].
The crowdsourcing logistics operation mode and the way the current taxi drops are almost the same. At first, a list of refrigerated items at the point of delivery will be loaded on to a mobile phone app, along with the delivery address and consignee information. Once the delivery staff see suitable objects for delivery, they will collect one and, once successfully collected, they will pick up goods at the end of the distribution of nodes and send the goods in accordance with the message received via the app. The personnel can choose an optimal route using the app, and, with gas coolant-controlled temperature ensuring the safe delivery of refrigerated items, the goods will finally be delivered into the hands of the consumers, as shown in Fig. 3 [4, 10].

The distribution flow diagram for individual customers. The flow of crowdsourcing logistics is that the consumers deliver express delivery information; the delivery man receives the information on the app and then collects the order. The successful delivery man distributes packages according to the information provided by the consumer. First, he plans the most suitable route for driving. Then he drives according to the route. Finally, the package will be delivered to the consumer. This completes the whole distribution activity. The cost of crowdsourcing logistics is low, it can effectively integrate the resources, and the delivery men are based on voluntary part-time people, the cost of human resources is greatly reduced, compared with the high human capital of traditional enterprises. Crowdsourcing logistics has a great advantage. In addition, crowdsourcing is conducive to the integration of idle resources in society
With the emergence of crowdsourcing logistics, those with free time can achieve social value through an increasingly mature and secure mobile Internet platform. The available couriers, distributing to every corner, can reach the entire logistics network, thus solving the last mile problem in the cold chain logistics and distribution network [11].
-
(4)
Solutions for medium-sized customers and large-sized customers
For large-sized customers, we directly deliver the shipped goods to the customer through full container load loading from the third-party distribution center; goods are no longer transported to the joint distribution center. Instead, they are carried out by means of full vehicle transportation.
As for the terminal distribution for medium-sized customers, we use a refrigerated container on a semi-trailer to transport the delivered container. The refrigerated container ensures a constant internal temperature; at the same time, a temperature insulation barrier is placed in the container to maintain different temperatures in different areas. The refrigerated container can be used to carry cold chain goods, and at the same time, it can also be loaded with normal-temperature goods. With three separate temperature regions in a refrigerated container, the insulation barrier can move back and forth and can be pushed to the end of the refrigerated container when not needed. The cold box has two partitions to create separate temperature zones and also has a temperature control device. The positions of the partitions can be adjusted according to the size of the goods, avoiding the problem that bulky goods cannot be loaded. The refrigerated containers are shown in Fig. 4.

Refrigerated containers that can be placed on a semi-trailer. The refrigerated containers can ensure the constant temperature in the containers. At the same time, the insulation board is placed in the refrigerator car to cut off the area of different temperatures in the refrigerated containers. In this way, the refrigerated containers can be loaded with cold chain cargo or normal temperature cargo, so that three temperature regions can be divided in a refrigerated container. The insulation boards can be moved forward and backward, it can be pushed to the side of the container when it is not needed. There are two baffles inside the refrigerated container, which are used to separate the areas and have a temperature control device on the container. The position of the baffle can be adjusted with the size of the goods to avoid the problem that the large goods cannot be loaded
The goods in the refrigerated container will already have been sorted and packed at the cold chain hub. Each refrigerator corresponds to a medium-end customer and is delivered without requiring boxes to be resorted and repacked. They are taken directly from the delivery vehicle that is responsible for regional distribution to customers. The mode of assembling can satisfy the transportation demand of the same customer for different kinds of goods [12].
With respect to the order of loading the refrigerated container, the principle of “put the first goods outside, the last goods inside” should be followed. In this way, the distribution of refrigerated containers does not have to be undertaken one by one, but it was delivered one by one in order to big customers. Regarding the cost of the distribution process, we need to choose the distribution route more carefully, plan the distribution order in advance, pack the goods according to the different requirements of temperature, and also consider the length of the route and attach importance to the reputation of the enterprise.
In order to improve the efficiency of the refrigerated containers and the vehicles transporting them, and to improve the profits of the enterprise, we will follow the “refrigerated goods, general cargo filling” principle—that is, the refrigerated transport of goods should be installed first when packing goods at all sites or centers. However, if the existing amount of refrigerated transport goods cannot meet an FCL, we move the temperature insulation barrier so that the refrigerated container has three different temperature spaces, and the goods can completely fill the container. Such measures not only ensure the full use of the refrigerator container and improve transport efficiency, but also result in the mixed loading and transportation of refrigerated goods and ordinary goods to reach a multi-container transport target, as shown in Fig. 5.

A semi-trailer model loaded with refrigerated containers. Semitrailer is used to transport refrigerators and carry out trunk distribution. A semitrailer can carry multiple refrigerators, each of which corresponds to a medium-sized terminal customer. The last delivered refrigerated container is placed in the innermost part; the first served refrigerated container is placed on the outermost part for easy loading and unloading. Each refrigerator corresponds to a medium-end customer and is delivered without requiring boxes to be resorted and repacked. They are taken directly from the delivery vehicle that is responsible for regional distribution to customers. Each refrigerated container can be fixed with a buckle, easy to transport. This way saves human resources and improves the efficiency of distribution
5 Selection of distribution routes for large and medium-sized customers
Based on the idea of the VRP, this paper addresses the problems related to the terminal distribution route of large and medium-sized customers. We will use mathematical model and time window constraints to study the route optimization problem.
5.1 Assumptions
In order to abstract the problem into a mathematical model, this paper makes the following assumptions:
-
(1)
The aim is to study the distribution between a single distribution center and the needs of multiple users;
-
(2)
The logistics distribution center has a certain number of transport vehicles. At the same time, each delivery vehicle load is known, and all the standard distribution vehicles are consistent;
-
(3)
The end distribution vehicle starts from the distribution center and serves all the required customers before returning to the distribution center;
-
(4)
Before the vehicle has left the first customer, the next service customer has been identified. The drivers will not change their route to serve other customers;
-
(5)
The basic distribution data for the service object includes demand, location, time window, and so on;
-
(6)
The type and capacity of easily perishable goods stored in the distribution centers are sufficient to meet the needs of all consumers, and sufficient transport vehicles are available for deployment;
-
(7)
The perishable goods required by each consumer must be delivered immediately to the transport vehicle that has completed the delivery;
-
(8)
If all the items in the distribution process are kept at a constant temperature during delivery, the decay of articles in distribution is only related to the transportation time [13].
5.2 Constraints
-
(1)
The total amount of goods carried by each transport vehicle shall not exceed the maximum carrying capacity of the vehicle;
-
(2)
Each consumer is served by only one truck;
-
(3)
Each customer must be served within a given time frame.
5.3 Model-building
-
(1)
Description of symbols
P = {P0, P, ⋯Pn}: Collection of customers and distribution centers, where n represents the number of customers, P0stands for cold chain distribution centers, and Pi(i = 1, 2, ⋯n) stands for customers;
R = {(Pi, Pj) : Pi, Pj ∈ p, i ≠ j}: Set of sections;
dis ij : Section (Pi, Pj) distance;
Q i : Customer i’s demand for goods;
Q′ i : Quality of goods when they arrive at customer location;
P1: Loss value of fresh products per unit;
K: Number of vehicles available in cold chain distribution centers;
G: Maximum load capacity of vehicle;
cgk: Fixed transport costs for vehicle K;
Vk: Speed of vehicle K;
\( {ct}_{ij}^k \): Cost of vehicle K when on the road—(Pi, Pj) (cost of oil, maintenance, maintenance and so on, proportional to the number of kilometers traveled);
Sk: Vehicle K departure time from distribution center;
ek: Time taken by vehicle K to return to distribution center when delivery task is completed;
[ta i , tb i ]: Soft time window of client i, where ta is the upper bound of the time window and tb is the lower bound of the time window;
[ta′ i , tb′ i ]: The hard time window of customer i, where ta′ is the upper bound of the time window and tb′ is the lower bound of the time window;
Z: A very large positive number;
\( {\mathrm{tc}}_i^k \): Arrival time of vehicle K at customer i;
\( {\mathrm{tf}}_i^k \): Time that vehicle remains at customer i;
\( {y}_i^k=1 \): Vehicle K delivers to customer i; otherwise, value is 0;
\( {x}_{ij}^k=1 \): Vehicle K passes through section (Pi, Pj); otherwise, value is 0;
CYS: Vehicle transportation cost;
CHS: Cost of damage;
CGD: Total fixed cost of vehicles;
\( {C}_{\mathrm{pen}}^i \): Customer i’s penalty cost for time windows of distribution centers.
-
(2)
Analysis of the distribution of cost
\( {C}_{ks}=\sum \limits_{i=1}^n\left({Q}_i-{q}_i\right){P}_1 \) (The loss cost of fresh goods due to its perishability);
\( {C}_{\mathrm{GD}}=\sum \limits_{k=1}^k{cg}^k \) (The fixed cost of vehicle—driver’s wages, costs, or rental for driving the vehicle);
\( {C}_{\mathrm{YS}}=\sum \limits_{k=1}^k\sum \limits_{i=1}^n\sum \limits_{j=1}^n{ct}_{ij}^k{x}_{ij}^k \) (The initial transport costs resulting from fuel consumption and maintenance).
-
(3)
Penalty function analysis
Before establishing the penalty function of the time window, the goods will be sent to buyers within the given time range, and the possible arrival and delivery situation and the economic loss to both sides will be analyzed. The time that the transport vehicle takes to reach the consumer can be defined according to the following three situations.
-
A.
If the delivery vehicle arrives before the agreed time window (i.e., early delivery);
-
B.
If the delivery vehicle arrives within the time window;
-
C.
If the delivery vehicle arrives after the agreed time window (i.e., delayed delivery).
[ta i , tb i ] for delivery time window agreed by the transport operators and the customer i; if the transport operators serves within \( \left[{\mathrm{ta}}_i^{\prime },{\mathrm{ta}}_i\Big),\Big({\mathrm{tb}}_i,{\mathrm{tb}}_i^{\prime}\right] \), the customer may still receive the services, but the operator will face a penalty cost; if the carriers deliver in the period \( \left[{\mathrm{ta}}_i^{\prime },{\mathrm{tb}}_i^{\prime}\right] \), it will seriously damage the interests of the distributors, who will be penalized. The diagram of this is shown in Fig. 6.
-
(4)
Analysis of specific penalty cost

Soft time window indication. Vehicle Routing Problems with Time Window (VRPTW) is an extension of the general vehicle routing problem. Its goal is to minimize the sum of vehicle travel time and waiting time when providing service to customers in the time window. According to the time constraint or not, it can be divided into two categories: soft time window (VRP) and hard time window (VRP). The soft time window VRP requires that access be reached within the time window as much as possible; otherwise, a certain penalty will be given, that is, when the vehicle arrives at the earliest arrival time, the cost of the loss is the penalty when the vehicle arrives at the latest arrival time, while the hard time window VRP requires that the vehicle must arrive within the time window; otherwise, the service will be rejected
For the question raised in the third distribution, this is the specific analysis:
-
A.
If the delivery vehicles arrive before the time window (it means “to reach the destination in advance.”), which can be divided into two types of scenario: The first scenario is that the delivery vehicle will hand over the goods immediately after they arrive at the customer’s location. This will be inconvenient to the customers and make the customers dissatisfied. However, the energy cost of the transport vehicles, the transport costs, and the cost of damage can be reduced. The second scenario is the transport vehicles waiting at the distribution station until the agreed time to hand over the goods; in this case, the cost of loss of energy and goods is the same as the expected loss. We assume that the second scenario should be preferred when the transport vehicle delivers in advance—that is, when the time window is open, the goods are handed over.
-
B.
If the delivery vehicle arrives during the time window, the items are transferred immediately. The transportation energy consumption cost and the cost of damage associated with the delivery time remain unchanged.
-
C.
If the delivery vehicles arrive after the agreed time window (i.e., the delivery is delayed), the items are transferred immediately on arrival. The transportation energy consumption cost and the cost of the damage related to the delivery time will increase, along with the penalty cost. The penalty cost function is given as yuan/hour, But in the actual operation, the transport service provider cannot serve within the agreed time unlimited, but must serve within the time range acceptable to the consumer, in order to complete the correct transaction. If the time limit is exceeded, the penalty cost is M yuan per hour. So we establish a penalty cost function as follows in Fig. 7.
Fig. 7 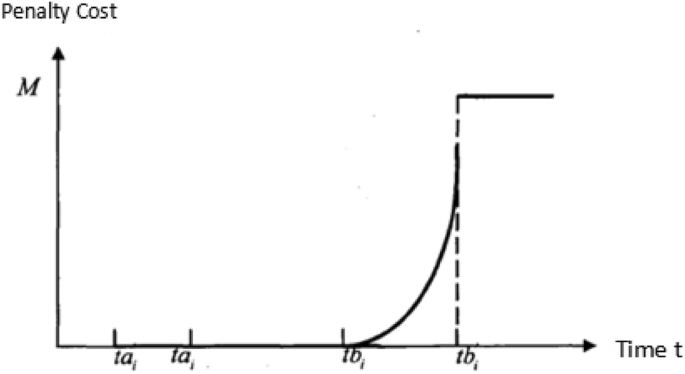
Fresh product distribution, soft window, penalty cost function. When consumers buy fresh products, they tend to buy products with a longer shelf life, so the probability of fresh products being sold decreases with the length of the remaining shelf life at the end of the sale. And the rate of decline increases as the preservation period approaches. In mathematical functions, exponential functions have the characteristics described above. On the other hand, the penalty cost should be proportional to the total value of the delivery product. So we established the soft time window penalty cost function of fresh product distribution

γ = η × p1, η, ω can be determined by actual adjustment.
(6) Model-building
According to the above analysis, the model below can be established.
\( {ta}_i^{\prime}\le {tc}_i^k\le {tb}_i^{\prime } \) (9) \( \sum \limits_{i=1}^n{y}_i^k{Q}_i\le {Z}^k,k=1,2,\cdots k \) (10).
The constraints in (2) give the cost of the optimal constraint solution; (3) that each consumer is served by only one delivery vehicle; at the same time, for each route, the starting and ending points are the distribution center; (4), (5) limit the flow conservation of each point; (6)–(8) state the time sequence constraint distribution, to ensure that the time to reach any two consumers does not conflict; (6) makes sure that the arrival of j of the customer must arrive after the arrival of the customer i; (7) ensures that the vehicle must start from the distribution center to reach customer i; (8) ensures that, on completing all deliveries, the transport vehicle returns to the distribution center; (9) the vehicle’s time window is limited; (10) the carrying capacity of the vehicle does not exceed the capacity of the vehicle.
6 Results and discussion
After the research, it is found that the terminal distribution mode is different for different customer groups. So according to the different demands of the customer groups, the end-points for distribution are divided into three groups: individual customers, large customers, and medium-sized customers, and in a search for a better mode of distribution for the three groups.
After analysis, we came to the conclusion that individual customers can use crowdsourcing logistics distribution mode, so that cold chain logistics companies can save more money. Large customers can use full-vehicle transportation delivery, so the speed of distribution can be improved, and the cost of transportation can be lower. For the medium-sized customers, the use of semi-trailer which can load refrigerated containers can save resources, greatly improve the efficiency of distribution, and can meet the transport needs of the same customer for different kinds of goods.
7 Conclusions
This article studies the current situation of cold chain logistics terminal distribution in electronics commerce, supermarkets, and the food and beverage industries. We found some problems in the terminal distribution, such as high cost of cold chain transportation, low level of automation, no standardization of company service, and poor quality of distribution service. Having studied the distribution damage costs and the energy costs as influenced by the characteristics of fresh perishable products, we have built a damage and energy cost function. In relation to the transportation and fixed vehicle costs, we have established a basic model for fresh product distribution (Fig. 7). With further research into the real-time restrictions of the time window, we established the penalty cost function of the soft time window to modify the original model. Through the example used in this study, the correctness of the time window function has been verified. And based on the idea of common distribution, the distribution demands of many industries are centralized by the third-party logistics company, which improves the speed of distribution and the efficiency of logistics operation. This article also designs the transport model of the combination of refrigerated containers and semi-trailer, which is helpful to improve the distribution efficiency and provide a feasible solution for the cold chain logistics distribution.
Abbreviations
- FCL:
-
Full container load
- VRP:
-
Vehicle routing problem
References
Coulomb, D (2015). The cold chain: A key component in the development process. International Journal of Refrigeration, 67, v-vi.
C Chang, LW Lan, M Lee, An integrated container management model for optimizing slot allocation plan and empty container repositioning. Maritime Economics and Logistics 17(3), 315–340 (2015)
G Arduino, D Carrillo Murillo, F Parola, Refrigerated container versus bulk: Evidence from the banana cold chain. Marit. Policy Manag. 42(3), 228 (2015)
A Uçar, AÖ Ozçelik, Individuals’ knowledge and practices of the cold chain. Ecology of Food and Nutrition 52(2), 116–129 (2013)
J Brito, FJ Martinez, JA Moreno, et al., Fuzzy optimization for distribution of frozen food with imprecise times. Fuzzy Optim. Decis. Making 11(3), 337–349 (2012)
R Badia-Melis, UM Carthy, I Uysal, Data estimation methods for predicting temperatures of fruit in refrigerated containers. Biosyst. Eng. 151, 261–272 (2006)
YF Zou, RH Xie, GH Liu, Safety reliability optimal allocation of food cold chain. Agric. Sci. 04(9), 70–75 (2013)
G Alvarez, Cold chain refrigeration innovations the FRISBEE project. J. Food Eng. 148, 1 (2015)
E Adida, N Ratisoontorn, Consignment contracts with retail competition. Eur. J. Oper. Res. 215(1), 136–148 (2011)
KW Pan, KK Lai, SCH Leung, D Xiao, Revenue-sharing versus wholesale price mechanisms under different channel power structures. European Journal of Operational Reserch 203(2), 532–538 (2010)
X Zhao, DR Atkins, Newsvendor under simultaneous price and inventory competition. Manufacturing & Service Operations Management 10(3), 539–546 (2008)
X Zhao, Coordinating a supply chain system with retailers under both price and inventory competition. Prod. Oper. Manag. 17(5), 532–542 (2008)
K Kim, H Kim, SK Kim, et al., i-RM: An intelligent risk management framework for content-aware ubiquitous cold chain logistics. Expert Syst. Appl. 46, 463–473 (2015)
Acknowledgements
The research presented in this paper was supported by Ministry of University of Pretoria, South Africa.
Author information
Authors and Affiliations
Contributions
HL is the main author of this paper. He put forward the main idea, completed the establishment of the model framework, deduced the distribution route optimization model, and analyzed the results. LP and DJ gave some important suggestions for the design of terminal distribution tools and distribution flow. All the authors had read and approved the final manuscript.
Corresponding author
Ethics declarations
Competing interests
The authors declare that they have no competing interests.
Publisher’s Note
Springer Nature remains neutral with regard to jurisdictional claims in published maps and institutional affiliations.
Rights and permissions
Open Access This article is distributed under the terms of the Creative Commons Attribution 4.0 International License (http://creativecommons.org/licenses/by/4.0/), which permits unrestricted use, distribution, and reproduction in any medium, provided you give appropriate credit to the original author(s) and the source, provide a link to the Creative Commons license, and indicate if changes were made.
About this article

Cite this article
Liu, H., Pretorius, L. & Jiang, D. Optimization of cold chain logistics distribution network terminal. J Wireless Com Network 2018, 158 (2018). https://doi.org/10.1186/s13638-018-1168-4
Received:
Accepted:
Published:
DOI: https://doi.org/10.1186/s13638-018-1168-4