- Research
- Open access
- Published:
Land subsidence monitoring based on InSAR and inversion of aquifer parameters
EURASIP Journal on Wireless Communications and Networking volume 2019, Article number: 291 (2019)
Abstract
In order to accurately separate the elastic and inelastic deformation information caused by aquifer compression in the land subsidence signal, and to invert the hydrogeological parameters of high spatial and temporal resolution to better apply the groundwater-ground subsidence model, a CWT (Continuous Wavelet Transform) separation method for aquifer elastic and inelastic deformation signals based on CWT is adopted, and the deformation signal is extracted by InSAR technology. The large-scale synthetic aperture radar dataset obtained by Envisat satellite from 2007 to 2009 is collected to obtain the surface deformation characteristic of the area by SBAS-InSAR technology, and then the independence provided by the observation well is used. Using the independent water level data provided by the observation wells, combined with the vertical InSAR deformation component and the head data, the CWT method is used to separate the periodic deformation signal components and long-term trends. Finally, the isolated signal component is used to invert the elastic and inelastic storage coefficient based on the ground subsidence model. The settlement signal separation method used in this paper makes up for the shortcomings of the two kinds of information in the previous settlement signal that are difficult to separate, which allows for more accurate inversion of aquifer parameters and helps to understand the aquifer parameters and continuously manage groundwater resources.
1 Introduction
With large-scale urban construction and excessive groundwater extraction, the water levels of cities have dropped significantly, which caused a series of geological disasters, especially serious surface settlement. To strengthen the monitoring of urban surface subsidence and establish a groundwater-ground subsidence prediction model are an effective means to improve groundwater management. Subsidence monitoring results with fine spatial-temporal resolution can be obtained by InSAR (Synthetic Aiding Radar Interferometry, InSAR), which provides a large amount of observed data to inverse the parameters of land subsidence prediction model.
In order to monitor surface deformation in the long term with high precision, many studies have been conducted to solve various techniques. As a milestone, Ferretti et al. put forward time series processing method using permanent scatterers synthetic aperture radar interferometry (PS-InSAR) [1, 2]. Followed by small-baseline subset (SBAS) technology raised by Berardino et al. based on their research of low resolution and large scale of deformation [3]. SBAS-InSAR has a significant advantage in monitoring accuracy in the study of low-resolution wide-area deformation. Compared with PS-InSAR, SBAS-InSAR has the advantage of reducing the geometric and temporal decorrelation effec t[4,5,6]. At present, InSAR time series analysis has become a practical method in the research of urban subsidence worldwide [7,8,9,10,11,12,13,14,15].
Moreover, to inverse, the physical properties of aquifer within InSAR has drawn people’s attention. Conventional ways to acquire physical properties of aquifers are quite restrictive due to their spatial-temporal resolutions, which cannot well simulate the dynamic regimes of groundwater and land subsidence. To overcome this obstacle, Hoffman et al. firstly applied long time series InSAR measurement technology to quantify the land subsidence in California and reversely deduced coefficient of storage in the aquifers with one-dimensional compression and consolidation model in 200 2[16]. Later in 2014, Xu et al. applied the InSAR approach to inverse coefficient of storage in the aquifers in California on the basis of land subsidence model [17]. A number of scholars on geodesy and hydrogeology have provided guidance for this study [18,19,20]. However, the current method to retrieve the coefficient of aquifers storage based on InSAR technology can only inverse a rough range for the coefficient of storage, which cannot clearly distinguish elastic and inelastic deformation caused by elastic compression in the aquifers. Subsequently, two physical quantities, elastic coefficient and inelastic of storage, cannot be accurately estimated.
Therefore, an approach of continuous wavelet transform (CWT) to separate the signals of elastic and inelastic deformation in the aquifers on the basis of the InSAR time series technology was used in this paper. Moreover, an inversion method is suggested to estimate elastic and inelastic storage coefficients in the confined aquifer based on groundwater and land subsidence modeling. Figure 1 shows the main technical flow of this paper.
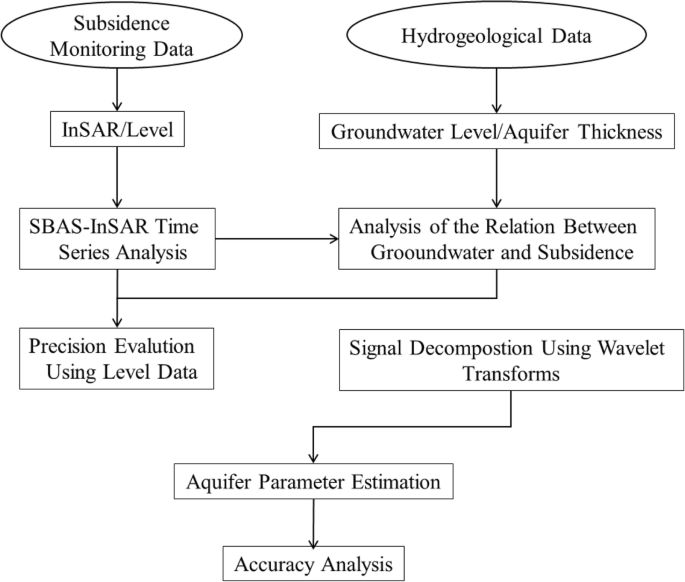
Main technical flow chart of this paper
2 Material and methodology
2.1 SBAS-InSAR theory
The small baseline InSAR approach (SBAS-InSAR) increases the coherence of an interferogram by using images of short spatial-temporal baseline, which reduces phase noise, and extracts highly coherent image elements by using multiple look processing on an interferogram, and obtains the least-squares solution of the minimum-norm of surface deformation rate of the image sequences through singular value decomposition. Based on the conventional difference interference technology, the SBAS technique has overcome the decorrelation of time and space baseline and improved the time resolution of monitoring so as to obtain information about surface deformation with higher precision and a long time-series [21]. This technique extracts image elements with high a coherence point through phase property and in a differential phase interferogram, the observation equation for the two highest coherence points (a, b) is
The six items in the above equation from the left to the right are
\( {\varPhi}_{a,b}^{k,\mathrm{unw}} \) :the differential interferometric phase of a, b after unwrapping;
\( {\varphi}_{a,b}^{k,\mathrm{topo}} \) :terrain error;
\( {\varphi}_{a,b}^{k,\mathrm{defo}} \) :terrain phase error;
\( {\varphi}_{a,b}^{k,\mathrm{aps}} \) :atmospheric disturbance;
\( {\varphi}_{a,b}^{k,\mathrm{noise}} \):decorrelation and thermal noise error;
\( {\varphi}_{a,b}^{k,\mathrm{orb}} \) :orbit error
Among the above-mentioned items, \( {\varphi}_{a,b}^{k,\mathrm{noise}} \), \( {\varphi}_{a,b}^{k,\mathrm{orb}} \), \( {\varphi}_{a,b}^{k,\mathrm{aps}} \), and \( {\varphi}_{a,b}^{k,\mathrm{topo}} \) are sources of errors. Atmospheric noise and orbit errors are low-frequency noises in space. Terrain error is low-frequency noise in a local area. Both of which can be observed in regression analysis through baseline information and be removed according to terrain error and the linear relation between interference and baseline [22,23,24]. Decorrelation and thermal noise are generally zero-mean-value, distributed Gaussian noises. Based on the characteristics of the aforementioned noises, the extraction of high correlation points uses the following formula (2):
In which, ψx, i means the interferometric phase of number x image element in interferogram i; N represents that there are N interferograms. \( {\hat{\psi}}_{x,i} \) means the estimated value of the relevant part of space, including information about subsidence, atmospheric disturbance, and orbit error, etc.; \( \varDelta {\psi}_{\theta, x,i}^u \) means visual angle error of the uncorrelated part of space, including elevation error irrelevant to space and errors caused by the offset of the image element phase center and physical center such as DEM error \( {\varphi}_{a,b}^{k,\mathrm{topo}} \), etc.; γx is the correlation coefficient of high correlation point in the time dimension. The higher the value of γx is, the nearer it is to the correlation point. Using data processing on different kinds of signal components are separated by using funnels and making iterative solutions according to formula (2) could work out the value of γx.
2.2 Method of CWT signal separation for aquifer elastic and inelastic deformation
It is a key step in the inversion of elastic and inelastic coefficients of storage to separate the vertical deformation using InSAR technology with the length of time series and short-period signals of the water level. As we know from the above, the coefficient of storage is calculated with the ratio of deformation in the aquifer (the vertical direction) and water level changes. However, the inelastic coefficient of storage will be lagged behind its elastic counterpart in terms of time. Therefore, we apply CWT to separate the deformation signals acquired by InSAR time series technology into long-term signals and short-term ones. We assume that long-term signals are inelastic deformation signals caused by compression in the aquifers while short-term signals are deformation signals in the aquifers caused by elastic compression to realize an independent inversion of elastic and inelastic coefficients of storage.
Assuming that the CWT time series, X(n) = {xn}n = 1, is the result of InSAR deformation and water level change, along with the step of time, δt can be defined as a convolution with scaled and normalized wavelet functions, ψ0, deformation in the field of wave can be expressed as such as:
Where a is a scale parameter, ψT is a complex conjugate function, and ψT(n, a)∗ is a convolution operator. The temporal resolution increases with the decrease of the spatial scale, and the frequency resolution decreases with the decrease of the spatial scale. In the Fourier domain, CWT can be calculated by the convolution theorem. The definition of wavelet full spectrum G at scale (a) is as follows:
Using linear algebra, Eq. (5) can be rewritten as follows:
Where Ψ is a n × n circulant matrix, ψ is the first row of Ψ, and each row vector is rotated by the forward element relative to the preceding one. Here, we use the derivative of the Gaussian wavelet function of degree m, which depends on the dimensionless time parameter η, and is defined as follows:
Set the value of m to provide a high spectral resolution suitable for identifying high frequency, low amplitude signals within the time series. Since the time series are padded with zeros, a cone of influence needs to be defined to identify the region of the wavelet spectrum, which is affected significantly by the edge effect [25].
In order to identify these regions, we use an exponential decrement time (√2a) for the autocorrelation wavelet spectrum at each scale [26]. This can ensure the discontinuity wavelet spectrum decreases by a factor. Therefore, at this point, the edge effect is negligible.
2.3 Inversion of the coefficient of storage in the aquifer
The settlement model which calculates the amount of subsidence adopts the soil mechanics model, with its equation:
In the equation, wInSAR refers to the compression amount of the aquifer with the thickness A in the time Δt. The InSAR elastic and inelastic deformation information can be separated from the above-mentioned CWT method, and the variable quantity of water level can be obtained by observing the groundwater level change of the well, and thus the coefficient of storage Ssk can be calculated inversely, which is divided into elastic and inelastic as follows:
The specific storage and coefficient of storage reflect the response of aquifer and aquifuge to groundwater level change in the aquifer system and both of them are important physical quantities in hydraulics that affect the groundwater unsteady flow as well as key parameters for the future establishment of groundwater-land subsidence coupling model [28, 29].
2.4 Study area and data selection
Tianjin, located in the northeastern part of the North China Plain, is the economic center of the Bohai rim and an important part of the Beijing-Tianjin-Tangshan economic belt. Tianjin area is a semi-arid zone, thus water resources have long been a crucial factor that restricts the economic development of the area. Over extraction of groundwater in this area has caused a sharp fall of the groundwater level as well as extensive land subsidence. The overall terrain of Tianjin inclines toward Bo Hai as a “dustpan” shape from the north to the south, from the west to the southeast.
The InSAR data processing part of this paper takes the main area of subsidence in southern Tianjin as the experimental area, and obtained 22 ASAR (Advanced Synthetic Aperture Radar) images of descending orbit from May 2007 to June 2009. The latitude of the center of each image is 39°10′ and the longitude of that is 117°5′. The maximum vertical baseline was 702.2 m, the average vertical baseline was 242 m, and the average time baseline was 205 days. All the above data are shown in Table 1. The location map of the study area and coverage area of SAR image is shown as Fig. 2.

Location map of study area and coverage area of SAR image
The blue frame is coverage area of SAR image. In order to study the relationship between land subsidence and groundwater exploitation, this paper selects a major area of land subsidence in Beichen District as the main study area as the black frame.
In this paper, data of groundwater in aquifers in the Beichen District provided by the Tianjin Institute of Geological Survey in the same period of time observed by InSAR technology (2007–2009) is used for the research of groundwater level. The temporal resolution of the water level data is 30 days.
3 Experimental results
3.1 SBAS-InSAR time series
This paper processes the data using the small baseline approach. It takes the ASAR data from March 14, 2008, as the main image and the geometric projections of other SAR images were all corrected to be consistent with the main image. The images with a time baseline higher than 35 days and lower than 600 days and space vertical components less than 450 m of the orbit baseline are selected, and they were combined to work out the figure of 85 interference pairs combined as shown in Fig. 3.

Figure of short baseline interference pairs combined
3.1.1 Generation of difference interferogram
Processing of difference interferogram: firstly, multiply the conjugate of interference pair images to get the interferometric phase which consists of a terrain phase and a deformation phase. Then, remove the terrain phase with DEM data, and interference fringe image is achieved with the remained phases. Figure 4 is a short baseline difference interferogram image.

Figure of short baseline difference interferogram image
3.1.2 Extraction of high coherent points and time series
In order to eliminate the deviation between  , the correlation coefficient of the time dimension, and the volume of a large sample, this paper revises the distribution of the correlation coefficient of the experimental data by simulating random noise and set
  larger than 0.6 as high coherent points [27]. Based on high coherent points, it establishes Delaunay triangular net on the space dimension and square grid on time dimension. It resamples the triangular net to unwrap the regular grid and eliminate atmospheric effect and orbit error through the filtering both on time dimension and space dimension. Finally, it establishes an observation equation of coherent objects and solved it through singular value decomposition (SVD) to get the surface subsidence rate of the research area (as shown in Fig. 5).

Subsidence rate of the Tianjin area
In order to evaluate the precision of SBAS-InSAR results, this article selected several level points’ land subsidence rate from 2007 to 2009 which were provided by the office of Tianjin ground subsidence control work to contrast and analysis with the subsidence rate of the pixel which near these level points. Figure 6 shows the distribution of level observation points of study area. Figure 7 shows the correlation between level observation results and InSAR results, the correlation coefficient is 0.92 and InSAR results has a high consistency and relevance with the actual observation results of level.

Level points of the study area

Correlation been InSAR and level observation results
3.2 Temporal and spatial deformation feature of typical settlement funnel
The main layer of groundwater in Tianjin is the quaternary, confined aquifer. The groundwater in plain areas of Tianjin is over-exploited generally, causing a widespread drop in groundwater levels and falling funnels of groundwater in many places. The drop in groundwater levels caused by groundwater exploitation gives rise to the decrease of pore water pressure in aquifer and its adjacent aquifuge, thus causing water loss and solidification in aquifer and the compression of the soil layer, which finally leads to subsidence.
As seen in Fig. 4, namely, the figure of the average subsidence rate of Tianjin City from 2007 to 2009, influenced by the groundwater exploitation and the lithology thickness, uniformity of the soil and mechanics properties of the quaternary confined aquifer, the distribution of subsidence in Tianjin City is obviously uneven. In urban areas, subsidence develops slowly with an annual average subsidence rate of 10~30 mm/year. In the eastern region, subsidence is deteriorating continuously with an accumulative setting volume of 30~60 mm from 2007 to 2009 and an annual average setting volume of 20 mm/year. The southwestern region has huge setting volume and high sedimentation rate, for example, the annual average setting volume of Wuqing District is 20~70 mm/year, and in Jinghai District, the accumulative setting volume in two years is 50~100 mm and the annual average setting volume is 40~50 mm/a. Figures 8a and 8b are 3D simulation diagrams of the ground deformation in the study area (Beichen District).

Time-series surface deformation estimated by SBAS-InSAR. Time interval 35 days. a 2007. b 2008–2009
This paper selects Beichen District as the main subsidence area and divided the subsidence obtained from InSAR into four risk levels as shown in Fig. 9, namely, extremely severe affected areas (subsidence rate 50 mm/a–70 mm/a), severely affected areas (subsidence rate 35 mm/year–50mm/year), generally affected areas (subsidence rate 20 mm/year–35 mm/year) and slightly affected areas (subsidence rate 0 mm/year–20 mm/year).

Figure of subsidence risk ratings of Beichen District. a Subsidence rate of the Beichen District. b Subsidence risk of Beichen District. c A field picture of the Beichen District. The figure is plotted in the WGS 84 coordinate system
As seen from the figure, in Beichen District and its surrounding areas, over-exploitation of groundwater has caused the drop in groundwater level, the decrease of pore water pressure, the increase of effective stress, and the compression of the soil layer. As the thickness of the clay layer in the quaternary confined aquifer is uneven, the forms and distribution of subsidence funnel are obviously uneven.
To quantitatively study, the distribution characteristics and rules of subsidence funnel, an east-west section line A-A' and south-north section lines B-B' and C-C' at the center of subsidence funnel in areas where subsidence is extremely severe (red area) are drawn to analyze the change of subsidence gradient on two sides of the centerline of subsidence funnel. As can be seen from section distance—annual average setting volume figure obtained from Fig. 10, the subsidence gradient distribution on the two sides of the south-north section lines B-B' and C-C' takes on the shape of “V”, and the maximum subsidence rate on the two sides of B-B' and C-C' are 68.2 mm/a and 62.7 mm/a, respectively; while subsidence gradient distribution on two sides of the south-north section lines A-A' takes on the shape of “W”. It was observed that the two points with the maximum subsidence rate on the two sides of A-A' are the two subsidence funnel centers on either side of B-B' and C-C'. Thus it is proved that B-B' and C-C' are two independent subsidence funnels in the early stage, and gradually shows the tendency of joining together as time goes by with the continuous groundwater exploitation.

Figure of the deformation gradient on two sides of the section of subsidence funnel
3.3 Relation between groundwater and subsidence
The ground subsidence caused by underground water mining is a very complicated process, and it is the external cause is the change of underground water level; however, it is the internal cause is associated with uniformity of the soil, thickness, and control of the mechanical in the quaternary system. This paper takes Beichen District as the research area and analyzes the degree of coincidence of groundwater level measured in Beichen District and its surrounding areas with subsidence results through InSAR in the Beichen District.
As can be seen in Fig. 11a, b, the subsidence center in the area of over-exploitation approximately coincides with the groundwater funnel center and shows a tendency of slightly moving towards the northwest as a whole, from which it can be inferred that controlled by the thickness and property of the rock and soil, solidification speed of soft soil layer is slower than that of water head changes of groundwater after groundwater exploitation.

Coupled analysis diagram of water level and land subsidence in Beichen District. a Water-level contour map of confined aquifer II on the subsidence map. b Water-level contour map of confined aquifer III on the subsidence map
3.4 Separation of deformation signals in the aquifers
In this paper, we have adopted the method of CWT mentioned above to separate vertical deformation and time-series signals of the groundwater embedded depth and chosen Gaussian elementary waves as our wavelet function, so as to calculate the fractal dimensions of deformation in groundwater aquifer and groundwater embedded depth within 22 days in Beichen District respectively. Firstly, we regulate the original InSAR technology and data of water level, then we compute the range of strength in various periods using fast Fourier transform (FFT), next we sort out data of fitting units of the elementary waves, and lastly, we reckon the strengthen values in various periods of the elementary waves. In addition, before our transformation, we have interpolated appropriate amounts in the time series data of InSAR technology and water level changes, obtaining two temporal resolutions with the same data (Fig. 12).

A seasonal change in the water level of groundwater wells 4001 (a) and 1002 (b). The red curve represents the vertical displacement near the well sites and the black curve represents the change of the water level. Comparing Fig. 4a and b, it was found that (1) the groundwater level in the entire region of the region has risen significantly from 2008 to 2009. This can be explained by the fact that the surface uplift in 2008–2009 is related to the increase in groundwater level; (2) water levels in groundwater wells 4001 and 1002 in the area changed with seasonal variations.
Figure 13 shows the wavelet power spectrum and pixel-level analysis on the spectrum between vertical InSAR and time series of water level changes. Every figure has the lowest and the highest points with different colors and outlines showing the amplitude of wavelet coefficients or the intensity of frequency component. Vertical axes of the figures are frequencies (the reciprocal of the number of cycles) while the horizontal axes of the figures are time with various colors demonstrating the intensity of the frequencies. To clarify the changes in intensity, we select the logarithm of actual strength in the figures. Figure 15a shows two peaks of intensity near the points of 0.15 Hz and 0.20 Hz.

Ground settlement change of experimental site by wavelet analysis. a Ground settlement wavelet analysis of the experimental site (sampling interval 15 days). Ground settlement sequence map of the experiment site (sampling interval 15 days).
3.5 Parameter inversion
Figure 14 shows the curves of variations of elastic and inelastic coefficients of storage changing with time at the test sites of four gauging distance stations. Eleven stress periods are set, and the sampling interval is 20 days. The left side represents the curves of variation of elastic coefficient of storage changing with time at the four sites obtained by inversion, while the right side represents the curves of variation of inelastic coefficient of storage changing with time at the four sites obtained by inversion. It can be seen from the time series analysis chart of the elastic and inelastic coefficients of storage that in the aquifer that mainly consists of loose clay and silt, the value of \( {S}_{ke}^{\ast } \) is usually tens to hundreds of times bigger than \( {S}_{ke}^{\ast } \), and the same as the corresponding correlation coefficient [30,31,32]. The difference in magnitude between the two is 102. It can be judged that Tianjin’s land subsidence is slowing down and having a rebound trend; this conclusion will be verified in the future monitoring results of the new radar data. Figure 15 shows the inversion results of the elastic and inelastic water release coefficients in the study area.

Curve of elastic and inelastic water release coefficient over time. a Elastic water storage coefficient change curve of experiment site 1. b Inelastic water storage coefficient change curve of experiment site 1. c Elastic water storage coefficient change curve of experiment site 2. d Inelastic water storage coefficient change curve of experiment site 2. e Elastic water storage coefficient change curve of experiment site 3. f Inelastic water storage coefficient change curve of experiment site 3. g Elastic water storage coefficient change curve of experiment site 4. h Inelastic water storage coefficient change curve of experiment site 4

Regional distribution of water release coefficient
3.6 Recision of parameter inversion
In order to verify the practicability and accuracy of the above coefficient of storage inversion method in the actual land subsidence model simulation, this section analyzes the hydrogeological conditions of the study area with Tianjin as an example.
With groundwater development and utilization conditions being considered, the land subsidence model parameters were obtained through InSAR land subsidence inversion, and the groundwater-land subsidence coupling model of Tianjin was established. By substituting the coefficient of storage obtained by inversion into the model, adopting the software of groundwater-land subsidence prediction (Modflow [33, 34]) to simulate and calculate, and comparing the simulation results and the measured value of ground subsidence, the correctness of the model parameter inversion method was verified. Figure 16 shows the Subsidence-water level change correlation diagram of water level site 4001 and 1027. As shown in this figure, the correlation between groundwater level change, ground vertical deformation, and elastic water release coefficient of water wall site 4001 (a) and point 1027 (b). The inversion line represents the best elastic release coefficient of the water level site in 2007–2010 by least squares fitting. Two dashed lines represent the range of fluctuations obtained by inversion of the surface deformation within an error of ± 5 mm.

Subsidence-water level change correlation diagram of water level site 4001 and 1027. As shown in this figure, the correlation between groundwater level change, ground vertical deformation, and elastic water release coefficient of water wall site 4001 (a) and point 1027 (b). The inversion line represents the best elastic release coefficient of the water level site in 2007–2010 by least squares fitting. Two dashed lines represent the range of fluctuations obtained by inversion of the surface deformation within an error of ± 5 mm
By selecting a certain subsidence funnel InSAR from Beichen District and simulating land subsidence results, re-sampling the simulation results and comparing it with the InSAR results, typical funnel observation value and simulation value comparison accuracy analysis, Fig. 17, and residual distribution histogram Fig. 19 were finally accomplished.

Comparison of typical funnel observations and analog value. a InSAR result(mm). b Model simulation(mm). c Observed and simulated residuals. d P-P' direction observations, analog values, and residuals. e S-S' direction observations, analog values and residuals
Through analyzing the histogram, it can be indicated that the simulation results are generally consistent with the InSAR results with the errors basically concentrated in ± 10 mm and the maximum residual close to 15 mm. It can be concluded that the results simulated from the groundwater-land subsidence value model with coefficients of storage inverted from the settlement model by using InSAR deformation signals from the CWT method branch can meet the needs of understanding the general trend of land subsidence caused by groundwater mining but more accurate results cannot be obtained. There are various reasons for this, for example, the influence of fault zone and inaccuracy of mining data. It should also be taken into account that the compression of the layer of the first marine bed (Q42m) widely distributed in the urban and coastal areas and the effects on land subsidence brought by the background value of tectonic subsidence of the entire Tianjin City. It is clear that this model does not take these into consideration.
Comparison analysis is conducted between the model inversion value and InSAR monitoring results (Fig. 17d, e) with the positions of the two section lines as shown in the figure. The black line in the comparison analysis chart is the best fitting result of the three-dimensional coupling model and the black triangle is the actual InSAR monitoring results for the gauging distance station site.
Analysis of the correlation between the observed value and the simulated value is shown in Fig. 18, the statistical histogram of residual distribution of simulated values and measured values of sample sites are shown in Fig. 19.

Correlation analysis of observed and simulated values

Observation hole G1–G10 time-water depth drawing
Besides the larger subsidence area of the subsidence center, the inversion results of the site locations are relatively ideal, as shown in Fig. 20. The overall difference between the monitoring result and the inversion result is smaller, and the differences are basically smaller than ± 10 mm.

Comparison curve of InSAR measured and simulated values at well site. a well site XI202, b well site 1038-2, c well site 4009-5
4 Discussion and conclusion
In this paper, based on the inversion of the two physical quantities of elastic and inelastic coefficients of storage of underground aquifers, a CWT (continuous wavelet transform) separation method based on InSAR time series technology is proposed. Based on the method, the SBAS-InSAR technology was first used to obtain the surface time series deformation sequence in the south of Tianjin. Then, using the CWT vertical deformation and the buried depth of the groundwater time-series signal separation method, the temporal order information of the elastic and inelastic deformation of the underground aquifer within 220 days in Beichen District were separately calculated. Finally, based on the land subsidence earth layer compression model, the two parameters of elastic and inelastic coefficients of storage were separately inverted by adopting the information of elastic and inelastic deformation. This study provides more accurate parameters for the simulation of groundwater models and helps to understand aquifer parameters for the continuous management of groundwater resources.
Availability of data and materials
The datasets used and/or analyzed during the current study are available from the corresponding author on reasonable request.
Abbreviations
- ASAR:
-
Advanced synthetic aperture radar
- CWT:
-
Continuous wavelet transform
- InSAR:
-
Interferometric synthetic aperture radar
References
A. Ferretti, C. Prati, F. Rocca, Nonlinear subsidence rate estimation using permanent scatterers in differential SAR interferometry. IEEE Trans. Geosci. Remote Sens. 38, 2202–2212 (2000)
A. Ferretti, C. Prati, F. Rocca, Permanent scatterers in SAR interferometry. IEEE Trans. Geosci. Remote Sens. 39, 8–20 (2001)
P. Berardino, G. Fornaro, A New Algorithm for surface deformation monitoring based on small baseline differential SAR interferograms[J]. IEEE Trans. Geosci. Remote Sens. 40, 2375–2383 (2002)
B.N. Kampes, R.F. Hanssen, Ambiguity resolution for permanent scatterer interferometry. IEEE Trans. Geosci. Remote Sens. 42, 2446–2453 (2004)
A. Hooper, P. Segall, H. Zebker, Persistent scatterer interferometric synthetic aperture radar for crustaldeformation analysis, with application to Volcan Alcedo. Galapagos. J. Geophys. Res. 112, B07407 (2007)
O. Mora, J.J. Mallrqui, A. Broquetas, Linear and nonlinear terrain deformation maps from a reduced set of interferometric SAR Images[J]. IEEE Trans. Geosci. Remote Sens. 40(10), 2243–2253 (2003)
L. Zhang, Q. Sun, J. Hu, Potential of TCPInSAR in Monitoring linear infrastructure with a small dataset of SAR images: application of the Donghai Bridge, China[J]. Applied Sciences 8(3), 425 (2018)
Zhang L, Ding X, Lu Z. Deformation rate estimation on changing landscapes using temporarily coherent Point InSAR. Fringe Conference Proceedings, [C] 2012.
Z. Li, Correction of atmospheric water vapour effects on repeat-pass SAR interferometry using GPS, MODIS and MERIS data[D] (Newcastle University, 2005)
J. Foster, B. Brooks, T. Cherubini, et al., Mitigating atmospheric noise for InSAR using a high resolution weather model[J]. Geophysical Research Letters 33(16), 627–642 (2006)
P. Mateus, G. Nico, R. Tome, et al., Experimental study on the atmospheric delay based on GPS, SAR interferometry, and numerical weather model data[J]. Transactions on Geoscience & Remote Sensing 51(1), 6–11 (2013)
H.A. Zebker, P.A. Rosen, S. Hensley, Atmospheric effects in interferometric synthetic aperture radar surface deformation and topographic maps[J]. J Geophys Res Solid Earth 102(B4), 7547–7563 (1997)
F. Beauducel, P. Briole, J.L. Froger, Volcano-wide fringes in ERS synthetic aperture radar interferograms of Etna (1992–1998) [J]. Journal of Geophysical Research Solid Earth 105(B7), 16391–16402 (2000)
D. Remy, S. Bonvalot, P. Briole, et al., Accurate measurements of tropospheric effects in volcanic areas from SAR interferometry data: application to Sakurajima volcano [J]. Earth Planet Sci Letters 213(3–4), 299–310 (2003)
Crosetto M, Monserrat O, Herrera G. Urban Applications of Persistent Scatterer Interferometry[M]. Radar Remote Sensing on Urban Areas, 2010.
J. Hoffmann, D. Galloway, A.J. Howard, Inverse modeling of interbed storage parameters using land subsidenc- e observations[C] (Water Resour Res, California, 2003)
W.B. Xu, Z.W. Li, X.L. Ding, et al., Application of small baseline subsets D-InSAR technology to estimate the time senes land deformation and aquifer storage coefficients of Angeles area[J]. Chinese J.Geophys.(in chinese) 55(02), 452–461 (2012)
L. Zhu, H. Gong, X. Li, et al., Land subsidence due to groundwater withdrawal in the northern Beijing plain, China[J]. Engineering Geology. 193, 243–255 (2015)
H. Guo, Z. Zhang, G. Cheng, et al., Groundwater-derived land subsidence in the North China Plain[J]. Environmental Earth Sci. 74(2), 1415–1427 (2015)
Y.S. Xu, S.L. Shen, Z.Y. Cai, et al., The state of land subsidence and prediction approaches due to groundwater with drawal in China[J]. Natural Hazards 45(1), 123–135 (2008)
D. Ge, Y. Wang, L. Zhang, et al., Mapping urban subsidence with TerraSAR-X data by PSI analysis. IGARSS, 3322–3325 (2010)
H. Li, R. Wu, P. Han, et al., A robust estimation method to coregistration error for InSAR interferometric phase[C] Radar Conference. IEEE, 283–286 (2010)
Y.J. Zhang, H.F. Huang, Y.S. Zhang, et al., InSAR error modeling and error estimation method[J]. Acta Electronica Sinica 39(6), 1225–1230 (2011)
G. Liu, R.F. Hanssen, H. Guo, et al., Nonlinear model for InSAR baseline error[J]. IEEE Trans. Geosci. Remote Sens. 54(9), 5341–5351 (2016)
M.M. Miller, M. Shirzaei, Spatiotemporal characterization of land subsidence and uplift in Phoenix using InSAR time series and wavelet transforms[J]. J Geophys Res Solid Earth 120(8), 5822–5842 (2015)
J.D. Wu, J.C. Chen, Continuous wavelet transform technique for fault signal diagnosis of internal combustion engines[J]. Ndt & E International 39(4), 304–311 (2006)
O. Monserrat, M. Crosetto, M. Cuevas, et al., The thermal expansion component of persistent scatterer interferometry observations[J]. IEEE Geoscience & Remote Sensing Letters 8(5), 864–868 (2011)
M.L. ShenShuiLong, XuYeShuang, et al. Interpretation of increased deformation rate in aquifer IV due to grou. [J]. Canadian Geotechnical Journal 50(11), 1129–1142 (2013)
F.D. Tillman, S.A. Leake, Trends in groundwater levels in wells in the active management areas of Arizona, USA[J]. Hydrogeology Journal 18(6), 1515–1524 (2010)
D.L. Galloway, R. Bürgmann, E. Fielding, et al., Mapping recoverable aquifer-system deformation and land subsidence in Santa Clara Valley by using space-borne synthetic aperture radar[J]. Hydrogeological Engineering. 79(42), 229–236 (2000)
D.L. Galloway, T.J. Burbey, Review: Regional land subsidence accompanying groundwater extraction[J]. Hydrogeol J 19(8), 1459–1486 (2011)
J. Hoffmann, S.S. Toor, L.A. Rosendahl, et al., Hydrothermal liquefaction of biomass[J]. Brit J Nursing 10(21), 189–217 (2014)
Mcdonald M G, Harbaugh A W. The history of MODFLOW[M]. Springer Publishing Company, Incorporated, 2003.
G. Cao, Analysis and simulation of land subsidence caused by groundwater exploitation in the Hangzhou-Jiaxiang-Huzhou Plain, Southern China[J]. 2008. Hydrogeological engineering 57(31), 149–162 (2015)
Acknowledgements
Thanks to the ASAR data provided by ESA and also thanks to the hydrogeological data provided by the Office of Tianjin Controlled Settlement. The paper is supported by funds from the Department of Science and Technology at Guangdong Province and Guangzhou City (nos. 201604010051, 2015B090901060, 2016B090903001, 2016B090904001, 2016B090918126, 2016KZ010101, 2018B030338001, and 2018B010107003) and a fund from PengCheng Laboratory.
Author information
Authors and Affiliations
Contributions
ZWZ, YJL, and WJY conceived, designed, and performed the experiments. ZWZ, YJL, FL, and QL contributed to the analysis and discussions of the results. YJL and ZWZ drafted the manuscript. All authors reviewed and approved the manuscript.
Corresponding author
Ethics declarations
Competing interests
The authors declare that they have no competing interests.
Additional information
Publisher’s Note
Springer Nature remains neutral with regard to jurisdictional claims in published maps and institutional affiliations.
Rights and permissions
Open Access This article is distributed under the terms of the Creative Commons Attribution 4.0 International License (http://creativecommons.org/licenses/by/4.0/), which permits unrestricted use, distribution, and reproduction in any medium, provided you give appropriate credit to the original author(s) and the source, provide a link to the Creative Commons license, and indicate if changes were made.
About this article

Cite this article
Ziwen, Z., Liu, Y., Li, F. et al. Land subsidence monitoring based on InSAR and inversion of aquifer parameters. J Wireless Com Network 2019, 291 (2019). https://doi.org/10.1186/s13638-019-1602-2
Received:
Accepted:
Published:
DOI: https://doi.org/10.1186/s13638-019-1602-2