- Research
- Open access
- Published:
Energy optimisation of hybrid off-grid system for remote telecommunication base station deployment in Malaysia
EURASIP Journal on Wireless Communications and Networking volume 2015, Article number: 64 (2015)
Abstract
Cellular network operators are always seeking to increase the area of coverage of their networks, open up new markets and provide services to potential customers in remote rural areas. However, increased energy consumption, operator energy cost and the potential environmental impact of increased greenhouse gas emissions and the exhaustion of non-renewable energy resources (fossil fuel) pose major challenges to cellular network operators. The specific power supply needs for rural base stations (BSs) such as cost-effectiveness, efficiency, sustainability and reliability can be satisfied by taking advantage of the technological advances in renewable energy. This study investigates the possibility of decreasing both operational expenditure (OPEX) and greenhouse gas emissions with guaranteed sustainability and reliability for rural BSs using a solar photovoltaic/diesel generator hybrid power system. Three key aspects have been investigated: (i) energy yield, (ii) economic factors and (iii) greenhouse gas emissions. The results showed major benefits for mobile operators in terms of both environmental conservation and OPEX reduction, with an average annual OPEX savings of 43% to 47% based on the characteristics of solar radiation exposure in Malaysia. Finally, the paper compares the feasibility of using the proposed approach in a four-season country and compares the results against results obtained in Malaysia, which is a country with a tropical climate.
1 Introduction
The unexpected increase in subscribers and demand for high-speed data has led to tremendous growth in cellular networks in the last several years. In 2013, the number of mobile subscribers reached 6.8 billion [1], of whom 1 billion were in rural areas (off-grid sites) [2]. To access these new markets and provide a service to potential customers in remote rural areas, the number of BSs has been increased to fulfil the needs of mobile subscribers and increase the coverage area. According to [3], BSs are considered the primary source of energy consumption in cellular networks, accounting for 57% of the total energy used and putting the cellular operators under immense pressure to solve the problem of electricity supply in a reliable and cost-effective way. However, electrical grids are typically not available in these remote locations due to the geographical limitations (challenging terrain) that make access to these sites difficult. Therefore, supplying power to an off-grid BS is a significant challenge. Traditionally, a diesel generator (DG) is used to supply electrical power to a base station at an off-grid site [4]. Nevertheless, the concept of using DGs to power BSs has become much less viable for network companies looking to expand and deliver their services to potential new customers for the following reasons:
-
1.
Economic aspect: most of the costs go to the fuel, which is expensive, and the fuel price will continue to increase in the future. Additionally, the transfer of fuel to these remote places characterised by challenging terrain may require special means of transport, such as helicopters, which increases the cost of the operation [5]. Figure 1 presents the costs of operating DGs, which include the initial capital cost, installation cost, operating and maintenance (O&M) cost and fuel cost [6].
Figure 1 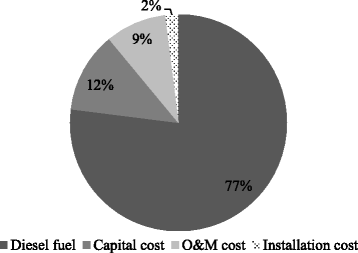
Net costs of operating a DG [6].
-
2.
Environmental impact: air pollution by harmful components emitted from diesel fuels such as carbon dioxide, sulphur dioxide and nitrogen oxides causes global warming, the depletion of the ozone layer, cancer, genetic mutations and acid rain. According to [7], the ICT sector’s CO2 emissions will rise to 349 MtCO2 by 2020, with 51% (179 MtCO2) of the emissions coming from the mobile sector. Accordingly, increasing awareness of the environmental impact of greenhouse gas emissions and the exhaustion of non-renewable energy resources (fossil fuel) has highlighted the critical need to improve the energy efficiency of cellular networks.
-
3.
Technical issues: the efficiency of the DG system is low, with only approximately 30% of the fuel energy being converted to electrical energy and the rest lost as heat [2]. In addition, BS sites supplied by DGs are not reliable; 65% of the telecom service losses are due to outages resulting from a variety of the failures from which these generators suffer [2]. When a failure occurs, the input of substantial time and money is generally required to bring a technician on site to perform the necessary repairs.

These drawbacks have motivated cellular network operators to search for solutions to both promote environmental conservation and reduce capital and operational costs. The specific power supply requirements for rural BSs, such as cost-effectiveness, efficiency, sustainability and reliability, can be met by utilising the technological advances in renewable energy. The network equipment deployed in these remote locations must be optimised so that they save energy while providing the best service with the largest coverage feasible. If network companies can install renewable energy supplies for their remote sites, they would gain access to hundreds of millions of potential new customers. Furthermore, by adopting renewable energy sources, network operators can reduce their operating expenses and have a positive impact on the environment via the reduction of harmful gas emissions.
The rest of this paper is organised as follows. Section 2 presents studies that have investigated the possibility of reducing both the OPEX and greenhouse gas emissions through the use of renewable energy systems in different zones of the world. Section 3 discusses the potential for using renewable energy to supply the BSs in remote places in Malaysia, and Section 4 describes the use of solar energy in Malaysia, including the characteristics of the solar radiation of Malaysia and the barriers to using solar photovoltaic (SPV) panels in Malaysia, as well as some recommendations. In Section 5, the system architecture for the hybrid power model to supply long-term evolution (LTE)-BS is described, and Section 6 presents the mathematical model. Section 7 briefly introduces the hybrid optimisation model for electric renewables (HOMER) software, a hybrid power system modelling tool used in this study, and Section 8 includes the simulation configuration. Section 9 presents the results and discussion. Section 10 presents the comparison and estimation of the feasibility of using the solar energy approach in Germany by using Malaysia as the central point of reference, and Section 11 concludes this paper.
2 Related studies
Over the last 5 years, significant developments have been made in integrating electrical grids and renewable energy into a smart grid to manage the power supply of BS sites. In India, efforts have been made to optimise the size of wind turbine generators (WTGs), SPV arrays and other components for a hybrid power system; generator-based power supplies for global system for mobile communication (GSM, alternatively referred to as 2G) and code division multiple access (CDMA, 3G) standards have also been investigated [8,9]. Reference [10] studied the feasibility of implementing a SPV/diesel hybrid power generation system suitable for a GSM base station site in Nigeria. Waqas et al. [11] presented the design idea for a solar system with a diesel generator as a backup source for a GSM cellular network standard in Pakistan. Reference [12] studied the feasibility of implementing an SPV/diesel hybrid power generation system suitable for a GSM base station site in Bangladesh. Martinez-Diaz et al. [13] discussed a photovoltaic (PV)-wind-diesel-battery system for a station in Spain. In Nepal, reference [6] studied the optimisation of a hybrid PV-wind power system for a remote telecom station. Kanzumba et al. [2] investigated the possibility of using hybrid photovoltaic/wind renewable systems as primary sources of energy to supply mobile telephone base transceiver stations in the rural regions of the Republic of the Congo. Reference [14] discussed three types of renewable energy: (i) a SPV-battery system, (ii) an SPV-fuel cell (FC) system and (iii) an SPV-FC-battery system. The modelling and size optimisation of such hybrid systems feeding a stand-alone direct current (DC) load at a telecom base station have been carried out using the HOMER software. Vincent et al. [15] proposed a hybrid (solar and hydro) and DG system based on the power system models for powering stand-alone BS sites. Table 1 provides a summary of related works that have been investigated for green wireless network optimisation strategies within smart grid environments.
3 Potential for applying renewable energy as the energy supply for BSs in remote sites in Malaysia
Malaysia lies entirely within the equatorial region, between 1° and 7° N and 100° and 120° E, offering an abundant potential for the use of renewable energy resources, especially solar and wind power [16].
In the early 1980s, a study of Malaysia’s wind energy was undertaken at University Kebangsaan Malaysia (UKM). The Solar Energy Research Group of UKM collected wind data from ten stations throughout the country over a period of 10 years from 1982 to 1991. The data studied include the hourly wind speed at the stations, which are located mostly at airports and near coasts, where the land and sea breezes may influence the wind regime [17]. The study showed that the mean wind speed is low, not exceeding 2 m/s. However, the wind does not blow uniformly, varying by month and region. The greatest wind power potential is that of Mersing and Kuala Terengganu, which are located on the East Coast of Peninsular Malaysia [18]. In 2014, reference [19] presented a study on predicting the wind speed in these states over the long-term using neural networks and a set of recent wind speed measurement samples from the two meteorological stations in these states. The results showed that the future mean wind speed will remain low, not exceeding 3 m/s. Therefore, wind turbines are rarely used in Malaysia and were excluded from this study.
Regarding solar energy, Malaysia has a stable climate throughout the year. Hence, the solar radiation in Malaysia is highly relative to global standards. Malaysia’s solar power is estimated to be four times the power of the world’s fossil fuel resources [20]. The global irradiation fluctuated in the range of 2 to 6 kWh/m2/day. The second part of the year (October to February) is characterised by more cloud cover and thus poorer solar potential than the first part of the year (March to October), and the average temperature ranges from 33°C during the day to 23°C at night [21]. Moreover, solar cells have low-maintenance needs and high reliability, with an expected lifespan of 20 to 30 years. One square metre of solar panelling in Malaysia is estimated to result in an annual reduction of 40 kg of CO2 [18], making solar power a promising future energy source for telecommunication applications.
4 Solar energy in Malaysia
Solar radiation data in Malaysia have been the subject of earlier studies. Malaysia’s climatic conditions are desirable for extending the utilisation of SPV systems due to the high amount of solar radiation received throughout the year. The northern region and a few places in eastern Malaysia receive the highest amount of solar radiation throughout the year. The lowest irradiance value is obtained for Kuching, whereas Kota Kinabalu has the highest measured solar radiation [16]. Figure 2 provides information on solar radiation in different states of Malaysia.

Annual average solar radiation (MJ/m 2 /day) [16].
Figure 2 reveals that Sabah, Perlis and Kedah have sufficient solar resources to support solar energy applications. Figure 3 presents the daily solar radiation in these three states.

Average daily radiation (kWh/m 2 ) [18].
The average daily solar radiation in Kedah, Sabah and Perlis is equal to 5.48, 5.31 and 5.24 kWh/m2, respectively. According to reference [22], the average solar radiation in these states indicates the high potential of SPV where the solar radiation is higher than 5 kWh/m2/day. Moreover, Figure 4 shows Malaysia’s average daily solar radiation, which is estimated to be 5.15 kWh/m2 [18].

Average daily solar energy received in Malaysia [18].
Accordingly, this study will investigate five average daily solar radiation values to cover all the states of Malaysia: 5.1, 5.2, 5.3, 5.4 and 5.5 kWh/m2.
4.1 Barriers to using SPV panels for remote areas in Malaysia
The aforementioned discussion reveals that Malaysia has excellent solar energy potential. However, some barriers that affect the performance of SPV panels should be considered, as power shortages are not admissible in the cellular network sector.
One of the major drawbacks of using solar cells is shade, which may dramatically reduce the power produced by the solar cell. In some seasons, tropical countries experience heavy rain and cloudiness that may continue for several days, causing battery banks to run out of charge more quickly. To solve this problem, the present study suggests the hybridisation of the solar power system with existing backup DG in rural areas, which will provide BSs with a sustainable and reliable power supply, especially if the battery lifespan is short.
Dirt, dust, tree debris, moss, sap, water spots, mould, etc. on solar panels have a significant impact on the performance of solar power systems. Cleaning the panels is also a problem. The SPV panels are installed at relatively high sites to maximise their access to the sunlight, and moss and grass grow quickly on the panels, increasing the cost of cleaning the panels. Therefore, we recommend installing solar panels on tilted roofs (with tilts of as little as 5° to 10°) to allow wind, rain and gravity to remove most debris and dust naturally.
In addition, the rapid growth of the surrounding trees will shade the panels, decreasing the performance of PV panels. Solar PV panels mounted on high poles also attract lightning strikes, the destructive voltage of which destroys the electronic components. Furthermore, the bypass diodes, which are mounted in the termination box under each panel, may crack under high humidity, heat and short circuits. One of the solutions is to engage trained educated villagers to operate, maintain and manage the solar panels.
5 System architecture
Figure 5 is a schematic showing two subsystems: the BS and the hybrid energy source.

System model of an adaptive power management scheme for remote LTE-BS.
5.1 Base station subsystem
The BS, a centrally located set of equipment used to communicate with mobile units and the backhaul network, consists of multiple transceivers (TRXs), which in turn consist of a power amplifier (PA) that amplifies the input power, a radio-frequency (RF) small-signal transceiver section, a baseband (BB) for system processing and coding, a DC-DC power supply, a cooling system and an alternating current (AC)-DC unit for connection to the electrical power grid. Table 2 summarises the power consumption of the different pieces of LTE-macro BS equipment for a 2 × 2 MIMO configuration, and three sectors where the total input power (Pin) needed by the LTE-macro BS is 964.9 W. More details on the BS internal components can be found in [23].
5.2 Hybrid energy source subsystem
The main components of a hybrid energy source subsystem are listed below:
-
1.
Solar panels: responsible for collecting sunlight and converting the sunlight into DC electricity.
-
2.
Diesel generator: used as a secondary energy source during the peak demand or in the case of battery depletion. The optimum operation range for a diesel generator is between 70% and 89% of its rated power [24].
-
3.
Battery bank: stores excess electricity for future consumption by the BS at night, during load-shedding hours, or if the available solar energy is not sufficient to feed the BS load completely. To protect the battery, inclusion of a charge controller is recommended. A charge controller or battery regulator limits the rate at which the electric current is added to or drawn from electric batteries, prevents overcharging and may protect against overvoltage, which can reduce battery performance or lifespan and may pose a safety risk. A charge controller may also prevent the complete draining (‘deep discharging’) of a battery or perform controlled discharges, depending on the battery technology, to protect battery life [24].
-
4.
Inverter: converts the DC voltage from the load bus-bar and battery to AC voltage at a high efficiency to satisfy the (BS) requirement of the main load for uninterruptible AC power. The inverter is also able to log information such as system performance (e.g. electricity produced by the system on a daily, monthly or yearly basis) and safety measures to avoid electrical mishaps [24].
-
5.
Control system: serves as the brain of a complex control, regulation and communication system. The most common communication units in the remote interface are wireless modems or network solutions. In addition to the control functions, data logger and alarm memory capabilities are of high importance. All power sources working in parallel are managed by a sophisticated control system and share the load with their capabilities to accommodate the fact that power shortages are not admissible in the cellular telephony sector.
6 Mathematical model
6.1 Photovoltaic system
The SPV generator contains modules that are composed of many solar cells interconnected in series/parallel to form a solar array. HOMER calculates the energy output of the SPV array (ESPV) by using the following equation [25]:
where Y SPV is the rated capacity of the SPV array (kW) and PSH is a peak solar hour which is used to express solar irradiation in a particular location when the sun is shining at its maximum value for a certain number of hours. Because the peak solar radiation is 1 kW/m2, the number of peak sun hours is numerically equal to the daily solar radiation in kWh/m2 [18] and f SPV is the SPV derating factor (sometimes called the performance ratio), a scaling factor meant to account for effects of dust on the panel, wire losses, elevated temperature or anything else that would cause the output of the SPV array to deviate from the expected output under ideal conditions. In other words, the derating factor refers to the relationship between actual yield and target yield, which is called the efficiency of the SPV. Today, due to improved manufacturing techniques, the performance ratio of solar cells increased to 85% to 95%.
6.2 Diesel generator
The energy generated (EDG) by a DG with a given rated power output (PDG) is expressed in Equation 2 [25]:
where μ is the efficiency of the DG. Moreover, the fuel consumption (FC) is calculated as follows [25]:
where E DG is the energy production (kWh) and F spe is the specific fuel consumption (L/kWh).
6.3 Battery model
The battery characteristics that play a significant role in designing a hybrid renewable energy system are battery capacity (Ah), battery voltage (V), battery state of charge (%), depth of discharge (%), days of autonomy (h), efficiency (%) and lifetime of battery (year). The ‘Trojan L16P’ battery model, which provides good characteristics as shown in Figure 6 combined with low cost, is used in this paper. More details can be found in [26].

‘Trojan L16P’ battery model characteristics.
The nominal capacity of the battery bank is the maximum state of charge SOCmax of the battery. The minimum state of charge of the battery, SOCmin, is the lower limit that does not discharge below the minimum state of charge, which is 30% in the ‘Trojan L16P’ battery model, as shown in Figure 6. The depth of discharge (DOD) is used to describe how deeply the battery is discharged and is expressed in Equation 4 [6]:
Based on Equation 4, the DOD for the ‘Trojan L16P’ battery is 70%, which means that the battery has delivered 70% of its energy and has 30% of its energy reserved. DOD can always be treated as how much energy the battery delivered.
A battery bank is used as a backup system and is sized to meet the load demand when the renewable energy resources failed to satisfy the load. The number of days a fully charged battery can feed the load without any contribution of auxiliary power sources is represented by days of autonomy. The battery bank autonomy is the ratio of the battery bank size to the electric load (LTE-BS). HOMER calculates the battery bank autonomy (A batt) by using the following equation [25]:
where N batt is the number of batteries in the battery bank, V nom is the nominal voltage of a single battery (V), Q nom is the nominal capacity of a single battery (Ah) and L prim,ave is the average daily LTE-BS load (kWh).
Battery life is an important factor that has a direct impact on replacement costs. Two independent factors may limit the lifetime of the battery bank: the lifetime throughput and the battery float life. HOMER calculates the battery bank life (R batt) based on these two factors as given in the following equation [25]:
where Q lifetime is the lifetime throughput of a single battery (kWh), Q thrpt is the annual battery throughput (kWh/year) and R batt,f is the battery float life (year).
6.4 DC/AC inverter
Inverters convert electrical energy from the DC form into the AC form with the desired frequency of the load. The efficiency of the inverter is assumed to be roughly constant over the entire working range (e.g. 90%) [27].
The optimum criteria, including economic, technical and environmental feasibility parameters, were analysed using the HOMER software package developed by the National Renewable Energy Laboratory (NREL).
7 HOMER hybrid power system modelling software
HOMER [25] is an optimisation software package used to simulate various renewable energy source (RES) system configurations and scale them based on the net present cost (NPC). The NPC represents the life cycle cost of the system. The calculation assesses all costs that occur within the project lifetime, including initial setup costs (IC), component replacements within the project lifetime and maintenance. Figure 7 presents the architecture of the HOMER software.

Architecture of HOMER software.
HOMER calculates the NPC according to the following equation [25]:
where TAC is the total annualised cost ($). The capital recovery factor (CRF) is given by:
where n is the project lifetime and i is the annual real interest rate. HOMER assumes that all prices escalate at the same rate and applies an annual real interest rate rather than a nominal interest rate.
The discount factor (fd) is a ratio used to calculate the present value of a cash flow that occurs in any year of the project lifetime. HOMER calculates the discount factor by using the following equation [25]:
NPC estimation in HOMER also considers the salvage cost, which is the residual value of the power system components at the end of the project lifetime. The equation used to calculate the salvage value (S) is as follows:
where rep is the replacement cost of the component, rem is the remaining lifetime of the component and comp is the lifetime of the component.
8 Simulation configuration
The lifetime of the project is 20 years, which represents the lifetime of the BS equipment and the solar cells. Between all the components in a base station, solar cells have been found to be the most expensive in terms of capital cost. Hence, solar cells have a lifetime of 20 years, which is the same as the project lifetime, so neither BS nor the solar cells require replacement during the 20-year period. In addition, the next-generation network, i.e. fifth generation (5G), is predicted to be implemented in the next 20 years, based on historical evolution from the previous legacy network cycle, e.g. 3G and 2G. The Malaysian annual real interest rate was 3.25% in 2014 [28]. HOMER makes a decision in each time step to meet the power needs at the lowest cost, subject to the constraints of the dispatch strategy chosen in the simulation and a set point of 80%. The system must supply electricity to both the load (base station system) and the backup power system each hour. In the present study, the backup power needs 10% of the hourly load requirement to retain enough spare capacity to serve the load even under a sudden 10% decrease in the renewable energy output within an hour. Moreover, several sets of sizes will be considered in the simulation, taking into account the SPV, inverter and number of batteries needed to achieve cost-effective, reliable and efficient performance in the optimisation process. The efficiency of the inverter is assumed to be roughly constant over the working range (e.g. 90%, based on [27]), and the battery efficiency is taken to be 85%. The DG configurations are based on [2], where the DG cost is $660/kW. The replacement cost is assumed to be $660/kW, and the operating and maintenance costs are $0.05/h. The diesel price is $0.7/L, and the carbon emission penalty is internationally set to $2.25/t. The technical specifications, costs, economic parameters and system constraints that are used in the present study are given in more detail in Table 3 below.
9 Results and discussion
Different average daily solar radiation values of 5.1, 5.2, 5.3, 5.4 and 5.5 kWh/m2 are used to simulate the application of solar energy across a wide range of Malaysian states (for a detailed discussion, see the first paragraph of Section 4). The total power consumption by the LTE-BS is 965 W (details given in Table 2). Additional configuration details are given in Table 3. The energy output, the economic analysis of the proposed hybrid systems and the related sensitivity analysis are provided in the following paragraphs.
9.1 Optimisation criteria
Table 4 includes a summary of the technical and economic criteria for the optimal design of the hybrid SPV/DG system at different daily radiation values.
The optimal size of the solar energy system is obviously the same for all solar radiation rates proposed (5.1 to 5.5 kWh/m2/day) for the same capacity of the DG (1 kW). However, the energy contribution differs, with the contribution of energy from the solar power system increasing with increasing radiation rate. This increase will decrease the energy contribution of the DG, lowering its operating period and providing the benefits of reducing both the operating costs and pollution rate.
The system costs consist of the following: (i) the initial capital cost is paid at the beginning of the project and decreases with decreasing size of the elements of the project, with the largest proportion of these costs going towards solar cells because of their high cost (approximately $4/W). Table 4 shows that the initial capital cost is fixed because the optimal system size is the same for all average daily solar radiation values studied. (ii) The operating cost is paid annually, and most of this cost goes towards operating and maintaining the DG. Table 4 indicates that the operating cost decreases with increasing solar radiation at the same optimal size of the system due to the increase in the energy contribution from the solar power system and the decrease in the energy contribution of the DG, which reduces the operating period of the DG. The NPC represents all costs that occur within the project lifetime, including initial setup costs, component replacements within the project lifetime and maintenance. More details will be provided in the next subsections.
9.2 Energy yield analysis
Figure 8 summarises the annual energy contribution of the solar electric system and the DG at different average daily solar radiation values. Higher solar radiation rates clearly correspond to higher annual energy contributions of the solar power system for the same SPV size stem series and less energy consumed by the generator. Thus, a higher solar radiation rate is desirable, as it decreases the maintenance and operational costs for the DG and the emission of polluting gases into the environment. The annual energy contribution of the solar electric system ranged from 43% to 47% for an average daily solar radiation value ranging from 5.1 to 5.5 kWh\m2, respectively.

Annual energy contribution of various sources for different average solar radiation values.
The following statistical analysis discusses the energy production based on an average daily solar radiation for Malaysia of 5.1 kWh/m2 as a case study based on the equations that are given in Section 6. However, this analysis can be extended to other cases, yielding a slight difference in daily peak solar hours per case depending on the average daily solar radiation.
The average annual energy consumption by LTE-macro BS is 8,453 kWh, which is computed as an LTE-macro BS load of 965 W, as given in Table 2 × 24 h × 365 days/year. The annual energy contribution of the solar system to the total energy production is 4,290 kWh, which is computed based on Equation 1. SPV rated capacity is 2 kW × peak solar hours 5.1 h × SPV derating factor 0.9 × 365 days/year, which equals 3,351 kWh. However, the tracking system plays a role in increasing the total amount of energy produced by a solar system by approximately 20% to 25%. The present simulation adopted a dual axis tracker which increased the total amount of energy by approximately 21.90% to become the annual energy contribution of the solar system at 4,290 kWh. The DG covered the remaining portion of the energy by 5,573 kWh, which represents 57% of the total energy production.
The total annual energy production of the hybrid system is 9,863 kWh (4,290 kWh of solar system + 5,573 kWh of DG), while the total annual energy needed by LTE-macro BS is 8,453 kWh. The difference between electrical production and consumption is equal to the excess electricity of 888 kWh/year, plus the battery losses of 112 kWh/year, plus inverter losses of 410 kWh/year.
The maximum energy contribution of the solar power system occurred in March and August. The average monthly energy contribution ranged from 510 to 564 kWh, and the average monthly energy contribution of the DG ranged from 675 to 636 kWh at 5.1 and 5.5 kWh/m2/day, respectively. Meanwhile, the minimum energy contribution of the solar power system occurred in October and February. The average monthly energy contribution was 467 kWh at 5.1 kWh/m2/day and 564 kWh at 5.5 kWh/m2/day. These results are attributed to the differences in the average solar radiation rate, as the second part of the year (October to February) includes more cloud cover and thus lower solar potential than the first part of the year (March to October).
The number of batteries in a string size is four batteries in parallel arrangement where the battery annual energy-in is 770 kWh, while the annual energy-out is 655 kWh, where the round-trip efficiency was 85%. Batteries can supply LTE-BS load autonomy for 6.27 h, which is computed based on Equation 5, (number of the batteries is 4 × nominal voltage of a single battery 6 V × nominal capacity of a single battery 360 Ah × 0.7 × 24) divided by (daily average LTE-BS load 23.2 kWh). However, one battery can supply LTE-BS load autonomy 1.57 h. The battery expected life is 6 years, based on Equation 6, number of the batteries 4 × battery lifetime throughput 1,075 kWh divided by battery annual throughput (713 kWh). Moreover, the inverter annual energy-in is 3,545 kWh, while the annual energy-out is 3,191 kWh, with 90% efficiency and 6,047 h/year operation.
9.3 Economic analysis
The following analysis discusses the cash flow based on an average daily solar radiation for Malaysia of 5.1 kWh/m2 as a case study, as shown in Figure 9. However, this analysis can be extended to other cases, yielding a slight difference in operating cost per case depending on the energy contribution of the solar power system, as explained in the above subsections.

Cash flow summary of the SPV/DG hybrid power system within the project lifetime for a solar radiation value of 5.1 kWh/m 2 /day.
The initial capital cost, paid once at the beginning of the project, is directly proportional to the size of the system. From Table 4, the initial capital cost is fixed at $11,210 because the optimal design found by the HOMER software for the hybrid power system is the same for all daily solar radiation values studied. The breakdown of this cost is as follows: (i) 71.4% for the SPV (size 2 kW × cost $4,000/1 kW = $8,000), (ii) 5.9% for the DG (size 1 kW× cost $660/1 kW = $660), (iii) 10.7% for the battery units (4 units × cost $300/unit = $1,200) and (iv) 12% for the inverter (size 1.5 kW × cost $900/1 kW = $1,350). In addition, the charger controller costs $2,000, and the control system cost depends on the system chosen. The SPV clearly represents the bulk of this cost.
The annual cost for the maintenance and operation of the system amounted to $1,707, as shown in Figure 9. Here, the DG represents the bulk of this cost ($1,621/year, including the fuel cost). A breakdown of this cost is $305 for DG maintenance per year based on a DG maintenance cost of $0.05/h (as given in Table 3) × annual DG operating hours 6,091 h (as given in Table 4) and a fuel cost of $1,316, equal to a total diesel consumption of 1,880 L per year, as shown in Table 4 (computed based on a specific fuel consumption of 0.388 L/kWh × annual electrical production of the DG of 5,573 kWh/year at 5.1 kWh/m2/day, as given in Figure 8) multiplied by the diesel price of $0.7/L. Thus, lower DG energy consumption and increased reliance on the solar power system create more operational expenses and are achieved under a higher solar radiation rate. Figure 10 highlights on the annual diesel cost for each solar radiation rate.

Fuel cost vs. global solar radiation rate.
Regarding the other components, the batteries, SPV and inverter cost $40/year, $20/year and $15/year, respectively.
Generally, the bulk of the replacement cost goes to the components with short operational lifetimes, which are the DG (4 years) and batteries (expected 6 years). The DG will be changed in years 5, 9, 13 and 17 at a cost of $660, while the batteries will be changed at a cost of $1,200 (4 units × $300/unit) in years 7 and 13. Moreover, the cost of replacing the inverter in year 15 is $1,350 (1.5 kW × $900/1 kW). The SPV array has a lifetime of 20 years, which is the same as the project lifetime, so neither requires replacement. Thus, the total replacement cost during the project lifetime is $7,590.
The economic analysis described above has been conducted on the basis of the nominal system. However, Figure 11, below, shows the discount factor for each year of the project lifetime based on Equation 9.

Discount factor for each year of the project lifetime.
The NPC of a system is the present value of all the costs that it incurs over its lifetime, minus the present value of all the revenue that it earns over its lifetime. Costs include capital costs, replacement costs, O&M costs and fuel costs. Revenues include salvage value. The total NPC calculates by summing up the total discounted cash flows in each year of the project lifetime as follows: include capital costs $11,210 + replacement costs $5,198 + O&M costs $5,680 + fuel costs $19,138 − salvage $1,038, equal $40,188 for solar radiation rate 5.1 kWh/m2. Figure 12 describes a comparison of the solar radiation rate and total NPC.

A comparison of the solar radiation rate and NPC.
The NPC clearly decreases with increasing solar radiation at the same optimal size of the system due to the increase in the energy contribution from the solar power system and the decrease in the energy contribution of the DG, which reduces the operating period of the DG, hence decreases the total operating and maintaining cost as well the fuel cost.
9.4 GHG emissions
Due to improved manufacturing techniques and higher volumes, the carbon footprint of solar panels is much lower than it once was. In general, as the solar radiation rate increases, the pollution rate decreases because the energy consumption of the DG and thus the operating period of the DG decreases. Figure 13 compares the solar radiation rate and annual pollutant emissions.

Pollutant emissions vs. global solar radiation rate.
10 Comparison of the feasibility of using the solar energy approach between Germany and Malaysia
Germany is the world’s top solar photovoltaic consumer. The annual number of daylight hours stands at approximately 1,300 to 1,900 h, and the annual average solar radiation is approximately 1,100 kWh/m2, where the level of average solar radiation ranges from 2.6 to 3.7 kWh/m2. Hence, the average daily solar radiation is estimated 3 kWh/m2 [29]. In addition, Germany represents a four-season country climate, which is useful for comparison purposes to validate the feasibility of the proposed off-grid solar energy approach in two different climates, i.e. tropical (Malaysia) and four season (German). The comparison is based on three key aspects: technical criteria, energy yield analysis and economic analysis. By taking into account the main differences in the average daily solar radiation, annual real interest rate of 1% [30], SPV cost of $2/watt [31] and diesel price $1.65/L in Germany [32] and $0.70/L in Malaysia.
Table 5 includes a summary of the technical and economic criteria for the optimal design of the hybrid SPV/DG system for both Malaysia and Germany. The lower solar radiation rates lead to larger solar system size. For Germany, the average daily solar radiation is 3 kWh/m2, which is equivalent to 58.8% of the average daily solar radiation in Malaysia. The designed system specification using the HOMER software consists of a 3.5 kW SPV array, a 1 kW DG, a 2.16 kAh/6 V storage battery (360 Ah × 6 units) and a 1.5 kW inverter for the same LTE-BS load. Although the solar system size for Germany is larger than the solar system size for Malaysia (as shown in Table 5), the initial capital cost in Germany is less than the initial capital cost in Malaysia because the price of solar system components is cheaper in Germany. However, the NPCGermany is higher than NPCMalaysia, which is approximately doubled. The main reason behind the doubling is the price of fuel, as will be explained in the following paragraphs.
Figure 14 summarises the annual energy contribution of the solar electric system and the DG. The annual energy contribution reached 43% (4,290 kWh) of the solar system based on the characteristics of Malaysia’s solar radiation exposure, and 57% (5,573) of the DG where the total annual energy production was 9,863 kWh. While, the annual energy contribution amounted to 42% (4,094 kWh) of the solar system based on the characteristics of Germany’s solar radiation exposure, and 58% (5,667 kWh) of the DG where the total annual energy production was 9,761 kWh.

The annual energy contribution of different energy sources for Malaysia and Germany.
Figure 15 describes the comparison of all of the costs that occur within the project lifetime for both Malaysia and Germany. The initial capital cost is directly proportional to the size of the system. However, the initial capital cost of the project in Germany is lower than in Malaysia because the price of the solar system components in Germany is lower than in Malaysia. The total maintenance and operation costs for Germany are higher than for Malaysia because the size of the solar system larger than the Malaysian solar system leads to high operating and maintenance costs. Replacement costs depend significantly on the discount factor which is given in Equation 9. If the real interest rate increases, the discount factor will decrease, and the replacement cost will also decrease. The real interest rate for Malaysia is 3.25% and for Germany is 1% for quarter 3 of 2014, so the discount rate for Malaysia is higher than for Germany which is reflected in the total replacement costs. The fuel cost represents the bulk of the NPC, which amounted to 48% of the total project cost for Malaysia and 70% for Germany. Hence, NPCGermany is double the value of NPCMalaysia. NPC estimation in HOMER also considers the salvage cost (based on Equation 10), which is the residual value of the power system components at the end of the project lifetime.

NPC comparison between Malaysia and Germany.
11 Conclusions
This study examined the feasibility of the integration of a solar power system with a DG to supply power to remote BSs in off-grid sites of Malaysia to minimise both the OPEX and carbon emissions. Three key aspects have been investigated: (i) energy yield analysis, (ii) economic analysis and (iii) greenhouse gas emissions. When the solar radiation rates increase, the energy produced from the solar power system will increase, which has the positive effect of reducing the emission of polluting gases and the operating cost of the system. In summary, the bulk of the initial cost of the system is the cost of the SPV due to its inherent high cost. Meanwhile, the bulk of the annual operating and maintenance costs go to the DG, and the bulk of the replacement cost goes to the DG and batteries. However, the average annual OPEX savings of the hybrid system was 43% to 47% depending on the solar radiation rate. Comparison between Malaysia and Germany shows that Malaysia’s climatic conditions are desirable for wide utilisation of the proposed off-grid hybrid system due to the high amount of solar radiation received throughout the year, in addition to lower project cost in the long run.
References
International Telecommunication Union (ITU) statistics database; available: http://www.itu.int/en/ITU-D/Statistics/Pages/stat/default.aspx, accessed 26.Aug.2014.
K Kanzumba, JV Herman, Hybrid renewable power systems for mobile telephony base stations in developing countries. Renew Energ. 51(2013), 419–425 (2013)
C Tao, Y Yang, H Zhang, H Kim, K Horneman, Network energy saving technologies for green wireless access networks. IEEE Commun. Mag. 18(5), 30–38 (2011)
MH Alsharif, R Nordin, M Ismail, Classification, recent advances and research challenges in energy efficient cellular networks. Wireless Pers. Commun. 77(2), 1249–1269 (2014)
H Ziaul, H Boostanimehr, VK Bhargava, Green cellular networks: a survey, some research issues and challenges. IEEE Commun. Surv. Tut. 13(4), 524–540 (2011)
P Subodh, DS Madhu, A Muna, SN Jagan, Technical and economic assessment of renewable energy sources for telecom application: a case study of Nepal Telecom, in Proc of 5 th International Conference on Power and Energy Systems (Nepal, Kathmandu, 2013). pp. 28–30
GeSI, Global e-sustainability initiative: SMART 2020: Enabling the low carbon economy in the information age. (2008); available: http://www.smart2020.org/_assets/files/02_smart2020Report.pdf, accessed 12. Nov. 2014
S Rath, SM Ali, MN Iqbal, Strategic approach of hybrid solar-wind power for remote telecommunication sites in India. Int. J. Sci. Eng. Res. 3(6), 1–6 (2012)
P Nema, R Nema, S Rangnekar, Minimization of green house gases emission by using hybrid energy system for telephony base station site application. Renew Sustain Energ. Rev. 14(6), 1635–1639 (2010)
AV Anayochukwu, EA Nnene, Simulation and optimization of hybrid diesel power generation system for GSM base station site in Nigeria. Elec. J. Energ. Environ. 1(1), 37–56 (2013)
WA Imtiaz, K Hafeez, Stand alone PV system for remote cell site in Swat Valley, in Proc of 1 st Abasyn International Conference on Technology and Business Management, Pakistan, 2013
S Moury, MN Khandoker, SM Haider, Feasibility study of solar PV arrays in grid connected cellular BTS sites, in Proc of 2012 International Conference on Advances in Power Conversion and Energy Technologies (APCET), Mylavaram, Andhra Pradesh, 2012, pp. 1–5
M Martínez-Díaz, R Villafáfila-Robles, D Montesinos-Miracle, A Sudrià-Andreu, Study of optimization design criteria for stand-alone hybrid renewable power systems, in Proc of International Conference on Renewable Energies and Power Quality (ICREPQ’13), 2013
P Bajpai, N Prakshan, N Kishore, Renewable hybrid stand-alone telecom power system modeling and analysis, in Proc of IEEE TENCON Conference, 2009
VA Ani, AN Nzeako, Potentials of optimized hybrid system in powering off-grid macro base transmitter station site. Int. J. Renew Energ. Res. 3(4), 861–871 (2013)
S Mekhilefa, A Safaria, WES Mustaffaa, R Saidurb, R Omara, MAA Younisc, Solar energy in Malaysia: current state and prospects. Renew Sustain Energ. Rev. 16(1), 386–396 (2012)
K Sopian, MY Othman, A Wirsat, The wind energy potential of Malaysia. Renew Energ. 6(8), 1005–1016 (1995)
H Borhanazada, S Mekhilefa, R Saidurb, G Boroumandjazib, Potential application of renewable energy for rural electrification in Malaysia. Renew Energ. 59(2013), 210–219 (2013)
H Borhanazada, S Mekhilefa, R Saidurb, VG Ganapathy, Long-term wind speed forecasting and general pattern recognition using neural networks. IEEE T. Sustain. Energ. 5(2), 546–553 (2014)
WA Azhari, K Sopian, A Zaharim, M Al Ghoul, A new approach for predicting solar radiation in tropical environment using satellite images e case study of Malaysia. WSEAS Trans. Environ. Dev. 4, 4 (2008)
T Khatib, A Mohamed, K Sopian, M Mahmoud, Solar energy prediction for Malaysia using artificial neural networks. Int. J. Photoenergy, vol. 2012, Article ID 419504, doi:10.1155/2012/419504, 1-16 (2012)
Green Power for Mobile, GSMA, Community Power Using Mobile to Extend the Grid; Available: http://www.gsma.com/mobilefordevelopment/wp-content/uploads/2012/05/Community-Power-Using-Mobile-to-Extend-the-Grid-January-2010.pdf, accessed 18. Nov. 2014.
G Auer, O Blume, V Giannini, I Godor, MA Imran, Y Jading, E Katranaras, M Olsson, D Sabella, P Skillermark, W Wajda, Energy efficiency analysis of the reference systems, areas of improvements and target breakdown. EARTH project report, Deliverable D2.3, 2010
G Schmitt, The green base station, in Proc. of 4th International Conference on Telecommunication - Energy Special Conference (TELESCON), 1–6, 2009
T Lambert, P Gilman, P Lilienthal, Micropower system modeling with HOMER (2006); available: http://homerenergy.com/documents/MicropowerSystemModelingWithHOMER.pdf, accessed 18. Nov. 2014.
Trojan Battery Company; available: http://www.trojanbattery.com/, accessed 18. Nov. 2014.
S Rehman, LM Al-Hadhrami, Study of a solar PVedieselebattery hybrid power system for a remotely located population near Rafha, Saudi Arabia. Energ. 35(12), 4986–4995 (2010)
Central Bank of Malaysia; available: http://www.bnm.gov.my/index.php?ch=statistic&pg=stats_convinterbkrates, accessed 28.Aug.2014.
International Energy Agency (IEA), Solar Energy Perspectives; available http://www.iea.org/publications/freepublications/publication/solar_energy_perspectives2011.pdf, accessed 18. Nov. 2014.
Organization for Economic Co-operation and Development (OECD); available: http://stats.oecd.org/index.aspx?queryid=86, accessed 18. Nov. 2014.
International Renewable Energy Agency (IRENA), Renewable Energy Technologies: Cost Analysis Series; available: http://www.irena.org/DocumentDownloads/Publications/RE_Technologies_Cost_Analysis-SOLAR_PV.pdf, accessed 18. Nov. 2014.
Fuel prices europe information; available: http://www.fuel-prices-europe.info/, accessed 17. Nov. 2014.
Acknowledgements
The authors would like to thank the Universiti Kebangsaan Malaysia for the financial support of this work, under the Grant Ref: ETP-2013-072.
Author information
Authors and Affiliations
Corresponding author
Additional information
Competing interests
The authors declare that they have no competing interests.
Rights and permissions
Open Access This article is distributed under the terms of the Creative Commons Attribution 4.0 International License (https://creativecommons.org/licenses/by/4.0), which permits use, duplication, adaptation, distribution, and reproduction in any medium or format, as long as you give appropriate credit to the original author(s) and the source, provide a link to the Creative Commons license, and indicate if changes were made.
About this article

Cite this article
Alsharif, M.H., Nordin, R. & Ismail, M. Energy optimisation of hybrid off-grid system for remote telecommunication base station deployment in Malaysia. J Wireless Com Network 2015, 64 (2015). https://doi.org/10.1186/s13638-015-0284-7
Received:
Accepted:
Published:
DOI: https://doi.org/10.1186/s13638-015-0284-7